
Technical Analysis of Oil (Alexander Sivtsov)
Oil is trading near zero marks during the Asian session.
The Brent graph (current price: $ 6,206.30 per 100 barrels)
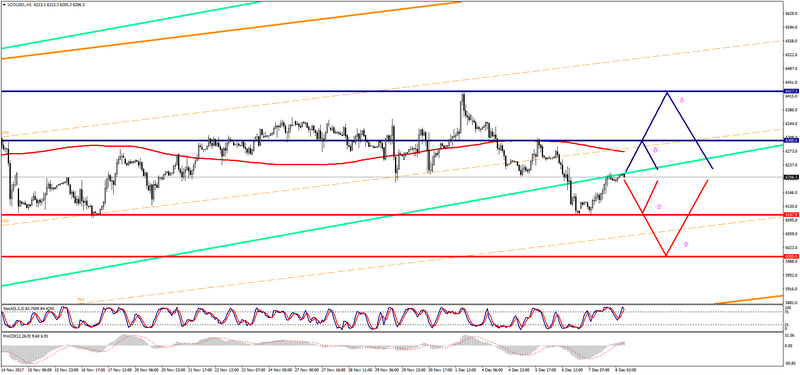
Brand Brent is trading near the zero mark during the Asian session.
- Resistance 1: From $ 6300.00 (psychological level)
- Resistance 2: From $ 6427.30 (December 1 maximum)
- Support 1: With $ 6107.90 (December 7 minimum)
- Support 2: From $ 6000.00 (psychological level)
Computer analysis: The Stochastic Oscillator movings on the H4 chart indicate overbought of the instrument, that is why there may be a slight decrease in Brent price.
The WTI graph (current price: $ 5663.80 per 100 barrels)
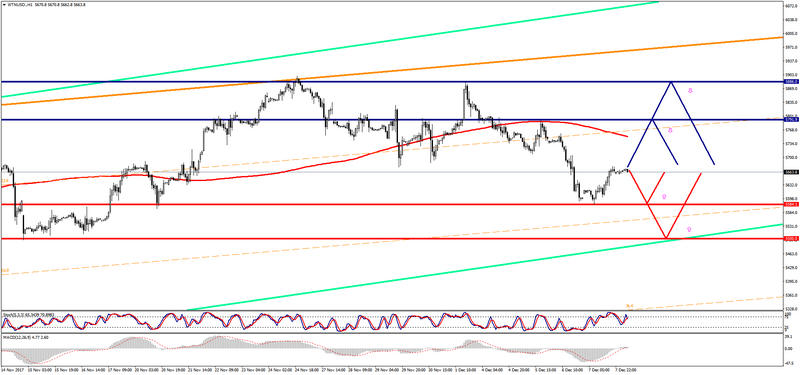
The WTI brand is trading just below the zero mark during the Asian session.
- Resistance 1: From $ 5791.90 (December 5 maximum)
- Resistance 2: From $ 5886.00 (December 1 maximum)
- Support 1: From $ 5584.10 (December 7 minimum)
- Support 2: From $ 5500.00 (psychological level)
Computer analysis: The Stochastic Oscillator movings on the H4 chart indicate overbought, which is why a slight reduction in the price of WTI is possible.