
Technical analysis of gold and silver (Alexander Sivtsov)
Gold chart (current price: $ 1333.87)
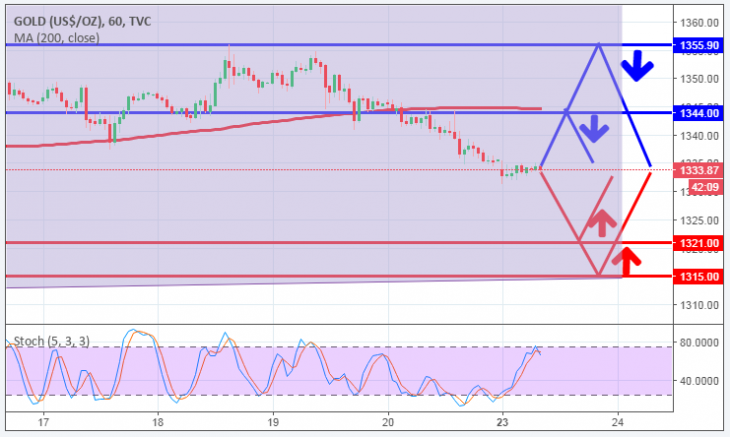
Gold is traded below the zero mark during the Asian session.
- Resistance 1: From $ 1344.00 (MA 200 on H1)
- Resistance 2: From $ 1355.90 (April 18 maximum)
- Support 1: From $ 1321.00 (technical level)
- Support 2: From $ 1315.00 (Support line of the Up Channel on H1)
Computer analysis: The Stochastic Oscillator movings on the chart of H4 indicate oversold of the instrument, against which the recovery of the price of gold is possible.
Silver chart (current price: $ 17,060)
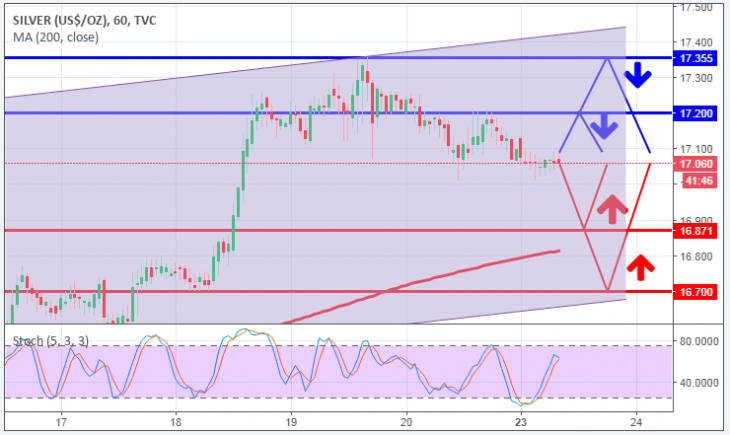
Silver is traded with a minus during the Asian session.
- Resistance 1: From $ 17.20 (technical level)
- Resistance 2: From $ 17.355 (April 18 maximum)
- Support 1: From $ 16.871 (April 11 maximum)
- Support 2: From $ 16.70 (technical level)
Computer analysis: The Stochastic Oscilliator movings for the H1 chart is in the neutral zone, against which the continuation of the price movement of silver in a narrow range is possible.