
Technical analysis of gold and silver (Alexander Sivtsov)
Gold chart (current price: $ 1333.40)
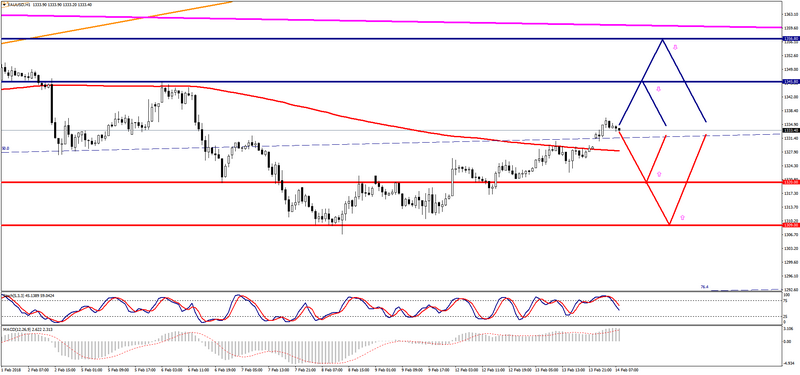
Gold is traded with a plus during the Asian session.
- Resistance 1: From $ 1345.80 (February 6 maximum)
- Resistance 2: From $ 1356.80 (January 26 maximum)
- Support 1: From $ 1320.00 (technical level)
- Support 2: From $ 1309.00 (technical level)
Computer analysis: The Stochastic Oscillator movings on the H4 chart indicate overbought of the instrument, against which there may be some decrease in the price of gold.
Silver chart (current price: $ 16.57)
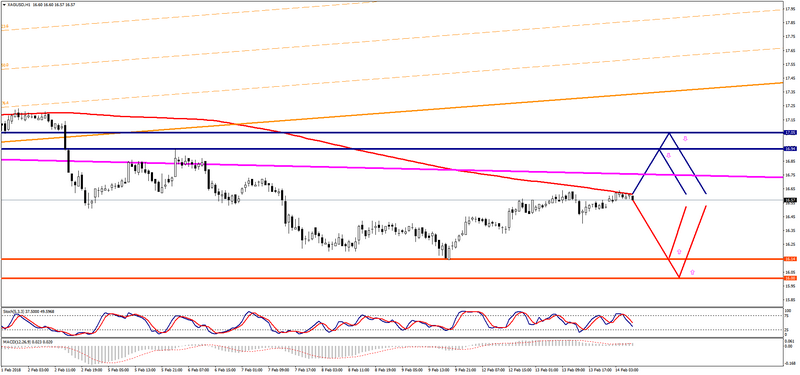
Silver is traded near the zero mark during the Asian session.
- Resistance 1: From $ 16.94 (February 6 maximum)
- Resistance 2: From $ 17.05 (February 1 minimum)
- Support 1: From $ 16.14 (February 9 minimum)
- Support 2: From $ 16.00 (psychological level)
Computer analysis: The Stochastic Oscillator movings on the charts of H1 and H4 are in the neutral zone. The continuation of the consolidation of the price of silver is possible.