Technical analysis of gold and silver (Alexander Sivtsov)
Gold chart (current price: $ 1323.70)
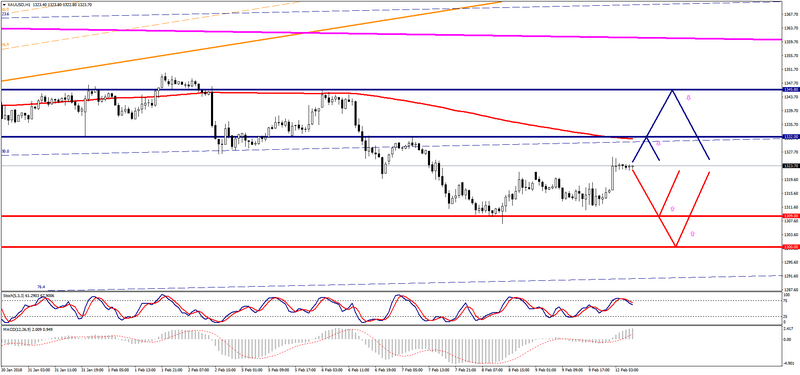
Gold is traded above the zero mark during the Asian session.
- Resistance 1: From $ 1332.00 (February 7 maximum)
- Resistance 2: From $ 1345.80 (February 6 maximum)
- Support 1: From $ 1309.00 (technical level)
- Support 2: From $ 1300.00 (psychological level)
Computer analysis: The Stochastic Oscillator movings on the H4 chart are in the neutral zone. One should expect the continuation of the consolidation of the price of gold.
Silver chart (current price: $ 16.43)
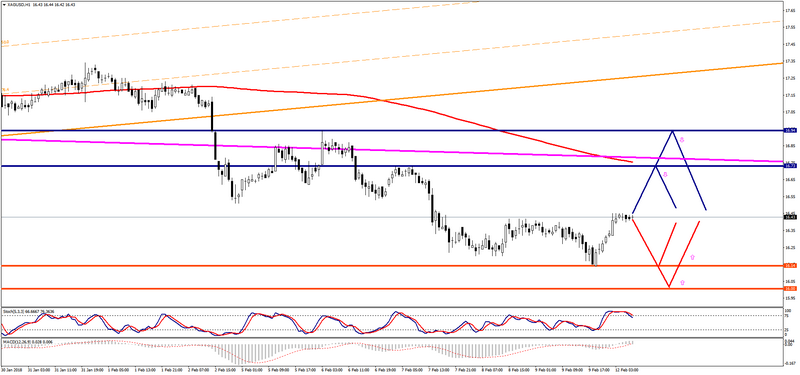
Silver is traded with a plus during the Asian session.
- Resistance 1: From $ 16.73 (February 7 maximum)
- Resistance 2: From $ 16.94 (February 6 maximum)
- Support 1: From $ 16.14 (February 9 minimum)
- Support 2: From $ 16.00 (psychological level)
Computer analysis: The Stochastic Oscillator movings on the H4 chart are in the neutral zone. The silver price movement may be limited in a narrow range during the European session.