
Technical analysis of gold and silver (Alexander Sivtsov)
Gold chart (current price: $ 1342.90)
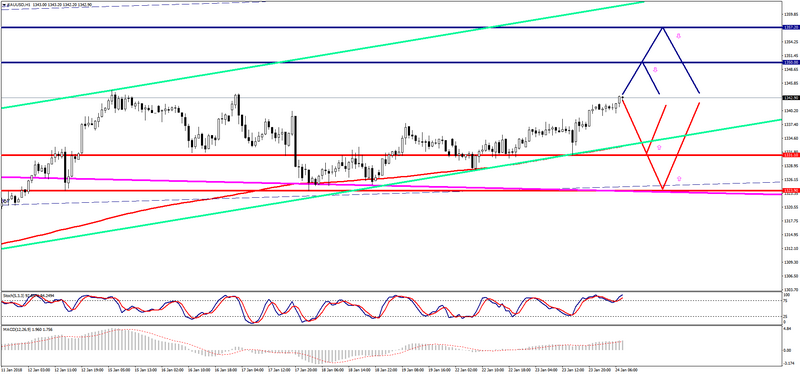
Gold is traded above the zero mark during the Asian session.
- Resistance 1: From $ 1350.00 (technical level)
- Resistance 2: From $ 1357.20 (September 8 maximum)
- Support 1: From $ 1331.10 (January 23 minimum)
- Support 2: From $ 1323.90 (January 18 minimum)
Computer analysis: The Stochastic Oscillator movings on the H4 chart indicate overbought of the instrument, so one should expect a downward correction in the price of gold.
Silver chart (current price: $ 17.02)
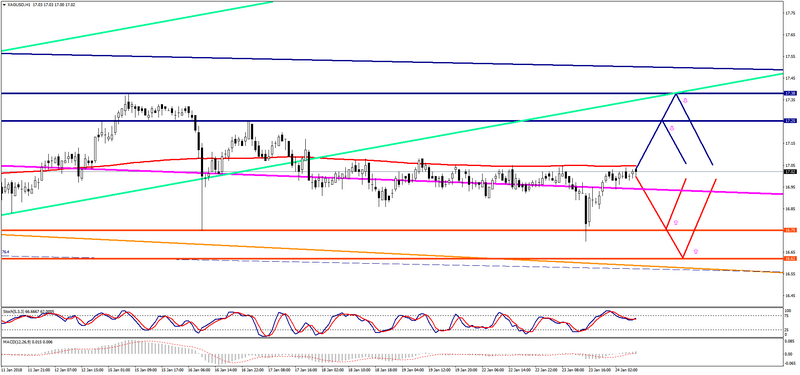
Silver is traded with a plus during the Asian session.
- Resistance 1: From $ 17.25 (January 17 maximum)
- Resistance 2: From $ 17.38 (January 15 maximum)
- Support 1: From $ 16.75 (January 16 minimum)
- Support 2: From $ 16.62 (technical level)
Computer analysis: The Stochastic Oscillator movings on the H4 chart indicate overbought of the instrument, which is why a silver price reduction is possible.