
Technical analysis of gold and silver (Alexander Sivtsov)
Gold chart (current price: $ 1291.80)

Gold is trading with a small plus during the Asian session.
- Resistance 1: From $ 1300.00 (psychological level)
- Resistance 2: From $ 1305.70 (October 16 maximum)
- Support 1: From $ 1281.00 (December 27 minimum)
- Support 2: From $ 1275.80 (December 22 maximum)
Computer analysis: The Stochastic Oscillator movings on the charts of H4 and D1 indicate overbought of the instrument, one should expect a downward correction in the price of gold.
Silver chart (current price: $ 16.73)
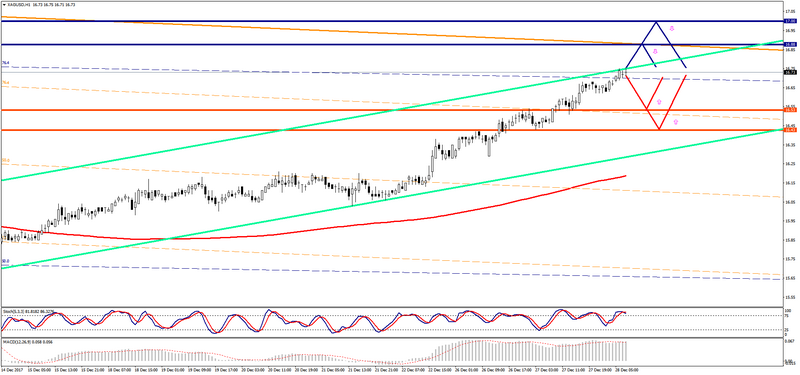
Silver is trading slightly above the zero mark during the Asian session.
- Resistance 1: From $ 16.88 (Low resistance line of the channel on H4)
- Resistance 2: From $ 17.00 (psychological level)
- Support 1: From $ 16.53 (December 26 maximum)
- Support 2: From $ 16.43 (December 27 minimum)
Computer analysis: The Stochastic Oscillator movings on the charts of H4 and D1 indicate overbought of the instrument, that is why there may be some reduction in the price of silver.