
Technical analysis of gold and silver (Alexander Sivtsov)
Gold chart (current price: $ 1265.00)
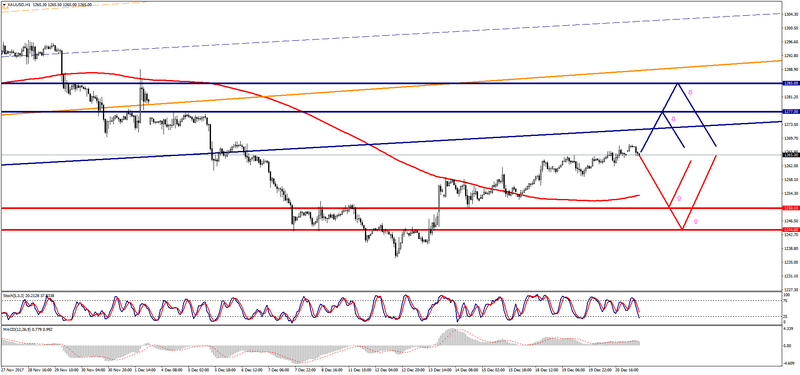
Gold is trading near the zero mark during the Asian session.
- Resistance 1: From $ 1277.00 (December 5 maximum)
- Resistance 2: From $ 1285.00 (technical level)
- Support 1: From $ 1250.10 (December 14 minimum)
- Support 2: From $ 1244.00 (technical level)
Computer analysis: The Stochastic Oscillator movings on the D1 chart are in the overbought zone, the reduction in the price of gold in the coming days is possible.
Silver chart (current price: $ 16.13)
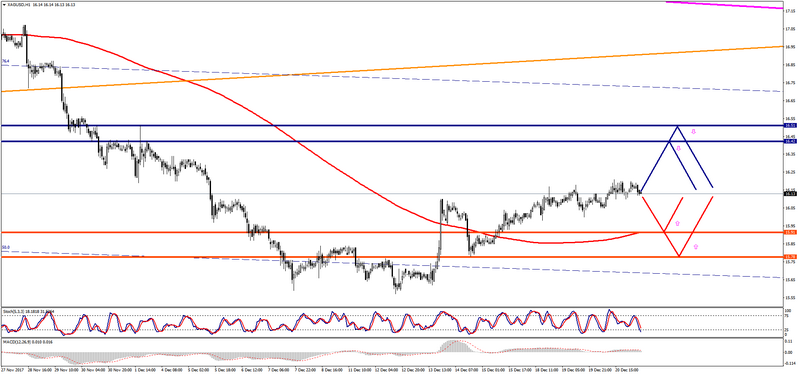
Silver is trading below the zero mark during the Asian session.
- Resistance 1: From $ 16.42 (technical level)
- Resistance 2: From $ 16.51 (December 1 maximum)
- Support 1: From $ 15.91 (MA 200 on H1)
- Support 2: From $ 15.78 (December 14 minimum)
Computer analysis: The Stochastic Oscillator movings on the D1 chart are in the overbought zone, which is why a silver price reduction is possible.