
Technical analysis of gold and silver (Alexander Sivtsov)
Gold chart (current price: $ 1263.50)
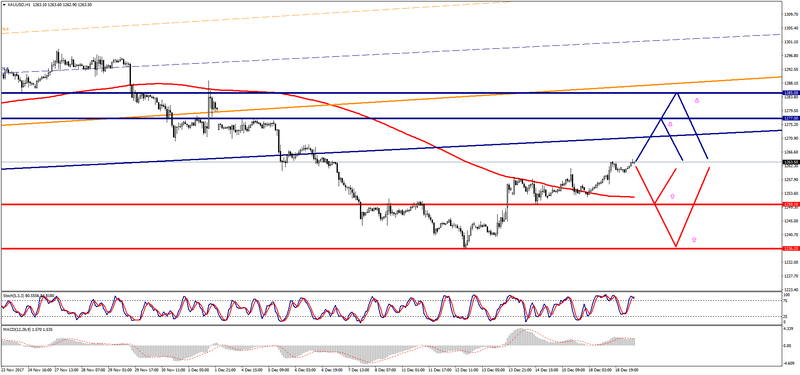
Gold is trading with a small plus during the Asian session.
- Resistance 1: From $ 1277.00 (December 5 maximum)
- Resistance 2: From $ 1285.00 (technical level)
- Support 1: From $ 1250.10 (December 14 minimum)
- Support 2: From $ 1236.20 (December 12 minimum)
Computer analysis: The Stochastic Oscillator movings on the chart H1 indicate overbought of the instrument, against which there may be some reduction in the price of gold.
Silver chart (current price: $ 16.11)
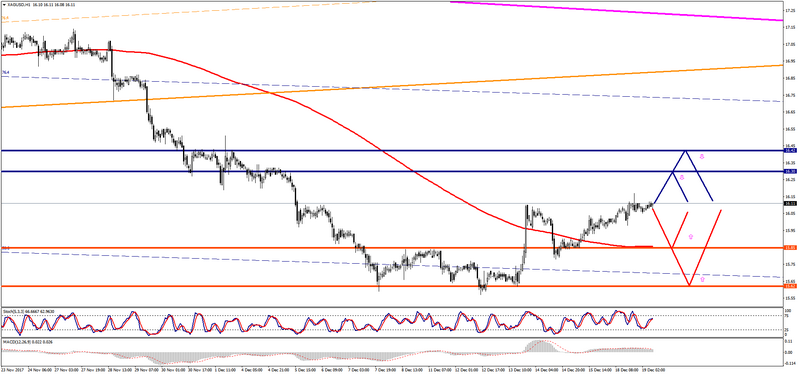
Silver is trading with a small minus during the Asian session.
- Resistance 1: From $ 16.30 (technical level)
- Resistance 2: From $ 16.42 (technical level)
- Support 1: From $ 15.85 (MA 200 on H1)
- Support 2: From $ 15.62 (December 13 minimum)
Computer analysis: The Stochastic Oscillator movings on the chart of H1 are in the neutral zone, that is why the consolidation of the price of silver is possible.