
Technical analysis of gold and silver (Alexander Sivtsov)
Gold chart (current price: $ 1295.50)
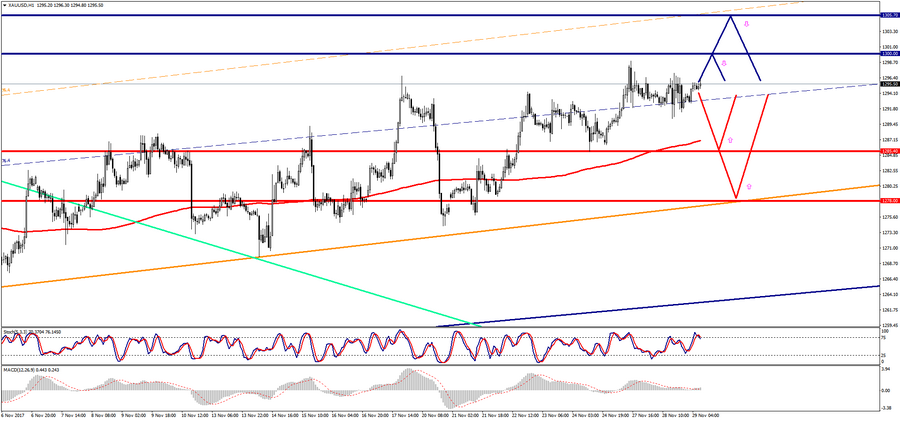
Gold is trading with a small plus during the Asian session.
- Resistance 1: From $ 1300.00 (psychological level)
- Resistance 2: From $ 1305.70 (October 16 maximum)
- Support 1: From $ 1285.40 (November 24 minimum)
- Support 2: With $ 1278.00 (Support Up Channel on H4)
Computer analysis: The Stochastic Oscillator movings on the H4 chart are in the neutral zone. So, the consolidation of the gold price is posssible.
Silver chart (current price: $ 16.84)
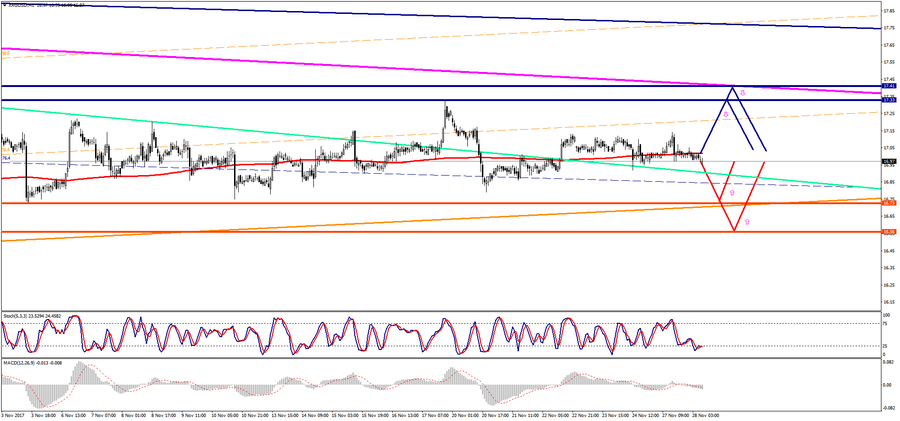
Silver is trading with a plus during the Asian session.
- Resistance 1: From $ 17.14 (November 27 maximum)
- Resistance 2: From $ 17.33 (November 17 maximum)
- Support 1: From $ 16.72 (November 28 minimum)
- Support 2: From $ 16.56 (October 27 minimum)
Computer analysis: The Stochastic Oscillator movings on the H4 chart indicate the oversold of the instrument, that is why one should expect the recovery of the price of silver.