
MACD indicator is a reliable tool for technical analysis. Anton Hanzenko.
MACD or Moving Average Convergence Divergence is one of the most common indicators for trading in the markets. It had been firmly established as a very reliable tool for technical analysis of the market and determining the current trend. The indicator belongs to the class of oscillators and is based on the principle of moving averages. However, MACD is much more efficient unlike moving averages because of no drawbacks in it as in moving averages.
MACD Features
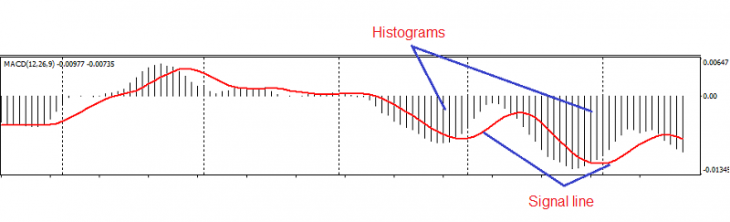
Externally, the indicator is an additional chart below the main price chart and consists of vertical histograms (vertical columns) and a colored signal line that move near the zero horizontal line.
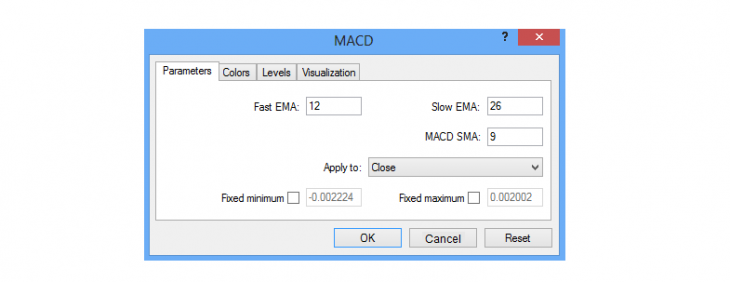
In the MACD settings, you can set the parameters of the indicator. Depending on the specified parameters, the indicator becomes more or less sensitive to price fluctuations. Increasing the values in the indicator settings slows down the indicator, which allows you to filter out false signals, but the reaction will be delayed. Lowering the settings makes the indicator more sensitive to price fluctuations, as a result, the indicator gives more signals, among which can be false signals.
The default indicator settings are quite acceptable for work.
There are four main indicator signals:
- The histogram is above the zero line, and the signal line in the body of the histogram – it indicates an uptrend.
- The histogram is above the zero line, and the signal line is out of the body of the histogram – it indicates a downtrend.
- The histogram is below the zero line, and the signal line in the body of the histogram is a downtrend.
- The histogram is below the zero line, and the signal line is out of the body of the histogram – it indicates an uptrend.
* The movements of the histogram and the signal too close to the zero line indicate a sideways trend and a flat in the market.
Divergence is a strong entry signal for the MACD indicator. There are bearish and bullish divergences, according to which we open a deal for sale or for purchase.
Bullish divergence on the indicator is an inconsistency in the movement of the price chart and the bars of the histogram.
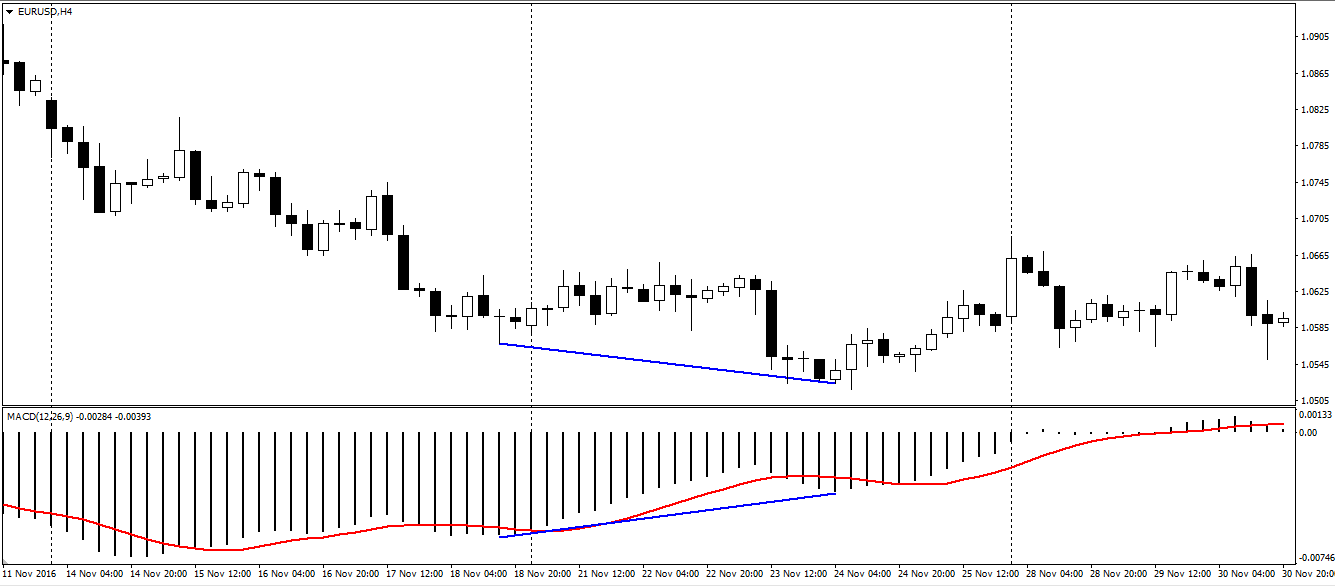
In this case, local minima prices on the price chart indicate a downward movement of the instrument, when local minima on the indicator histogram indicate the opposite movement. This signal is a buy signal according to the MACD indicator. A complete test of this signal is the histogram crossing of the zero line of the indicator.
Bear divergence is as follows.
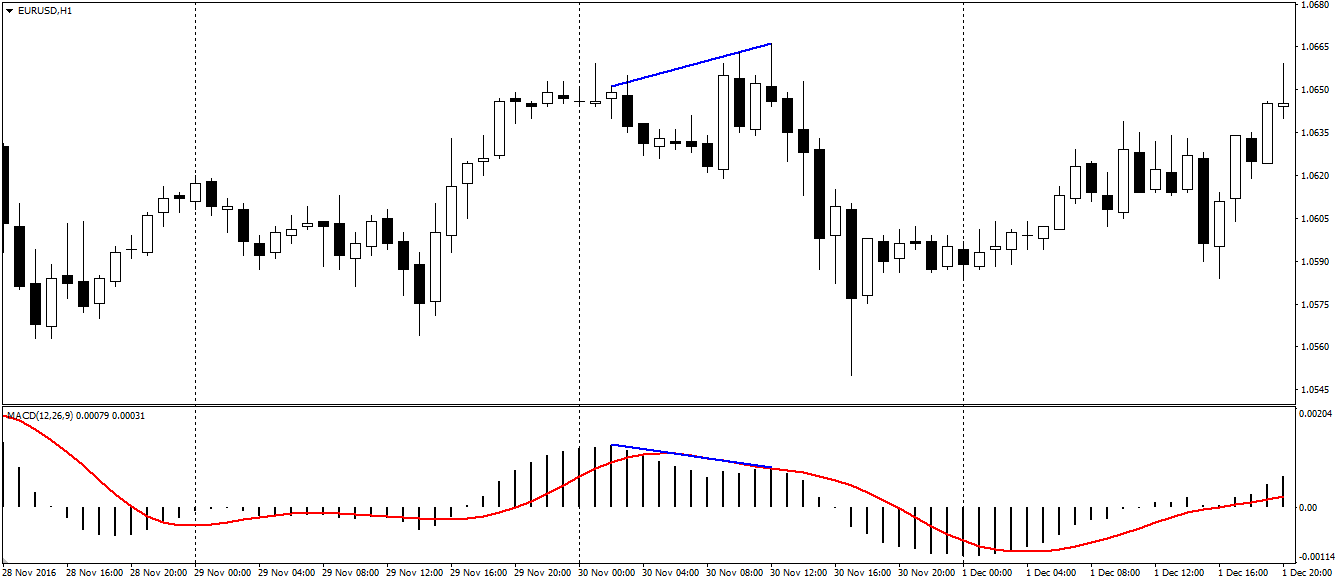
The difference between the local maxima of the price chart and the maxima of the indicator histograms indicates a bearish divergence, which signals a decrease in this instrument. The development of this signal, as well as bullish divergence, is the histogram crossing of the zero line of the indicator.
The divergence of the MACD indicator is a very strong signal to open a deal, however, for a more accurate and reliable entry into a trade, it is recommended to use auxiliary signals that allow you to hedge. Therefore, this indicator should be used with other indicators of technical analysis. MACD will be a great addition to any strategy and will help you to increase profits.
Follow the Trader’s Blog and offer your discussion topics to the blog – write us info@esterholdings.com.
Anton Hanzenko