
European rally. Not “love” triangle of the EUR/USD pair. Trading recommendations and overview
Good day for everyone living, floating and drifting on the waves of ForEx. With you captain of distant voyage and conqueror of the virtual seas of the currency market Andrew “Golden Eye” Green.
After the turbulent movements of last year and winter of 2017-2018, the situation on the euro is stabilized to a greater degree. The question is, how long?
The factors that rock the situation in the “Old” Europe are not weak and they are not small:
- uncertainty of the consequences and conditions of Brexit;
- the victory of the populists in Italy;
- continuation of economic sanctions against the Russian Federation;
- the aggravation of the political situation in Slovakia;
- current uncertainty with specifics about further actions on the ECB monetary policy.
It could be listed further, but these are more than enough to continue to shake, and so, not strong positions of the economy of the European Union.
The weekly chart for the pair (Chart 1), shows that the situation with the ritest zone 1.2700 remains in the long run, one of the most probable, but nevertheless the overall consolidation (narrowing) of the pair is obvious.
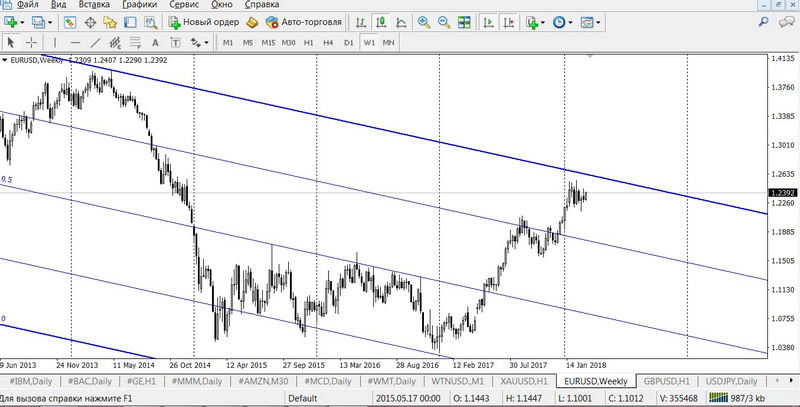
And the fact that the price is in the closest proximity to the resistance line of the descending weekly trend channel, only warms up the probability of a turn. In word word – a mess.
On the daily timeframe (Chart 2), the situation doesn’t become more simple.
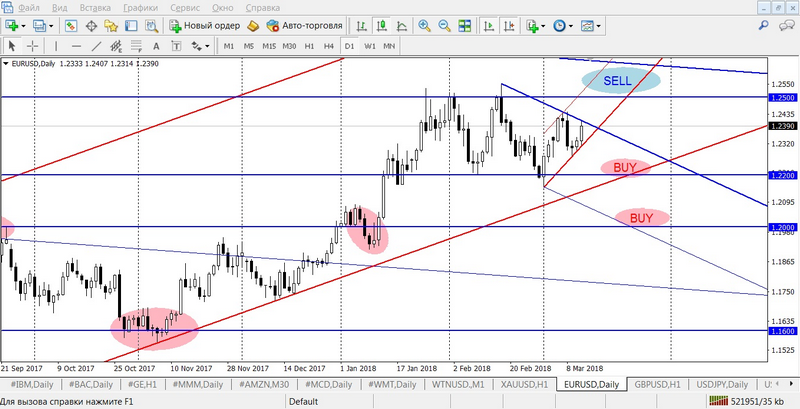
Here we have an obvious triangle between the levels of 1.2500 and 1.2300. The prospect of its development, in the case of an upward breakdown – to the level of 1.2500 and above. In the case of a downtrend, to 1.2200, with a high, in that case, the probability of a mid-term rising trend on the bottom.
And already traded timeframe, namely H1 and Figure 3.
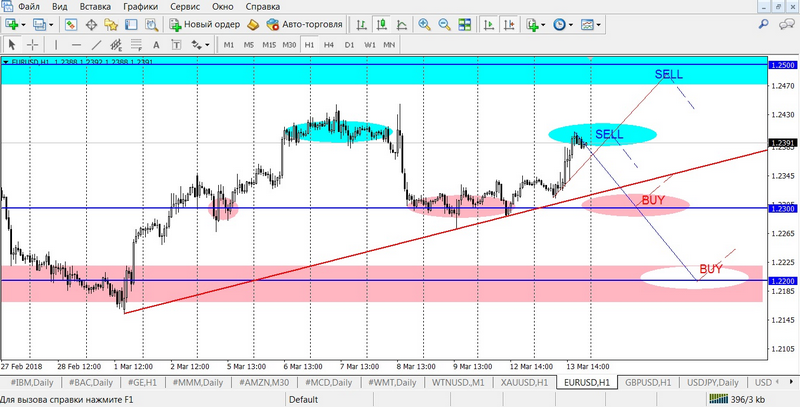
Here the recommendations are practically the same as last week’s benchmarks:
-
sale entry from 1.2400 and 1.2500;
-
buy entry from 1.2300 and 1.2200.
Examples of transactions:
- conservative option:
BUY limit 1.2200, SL 1.2140, TP 1.2280;
SELL limit 1.2500, SL 1.2560, TP 1.2410. - aggressive option:
SELL (current) 1.2392, SL 1.2450, TP 1.2310;
BUY limit 1.2300, SL 1.2250, TP 1.2380.
The trader’s view of the world is the search and use of opportunities, and not the search for reasons. Be pragmatic and do not succumb to geopolitical emotions,
you can earn money and it is necessary for both the “right” and the “left”.
Andrew Green