
Canadian GDP data
- GDP (m/m) (Feb), fact -0.1%, forecast 0.1%.
- Commodity Price Index (RMPI) (m/m) (Mar), fact 2.8%, forecast 3.9%.
Canadian GDP growth slowed more significantly than expected, putting a significant pressure on the Canadian dollar. Thus, Canada’s GDP on a monthly basis fell to its lowest level in the last two years, reinforcing the negative sentiment on the Canadian economy and speeding up the Canadian currency correction.
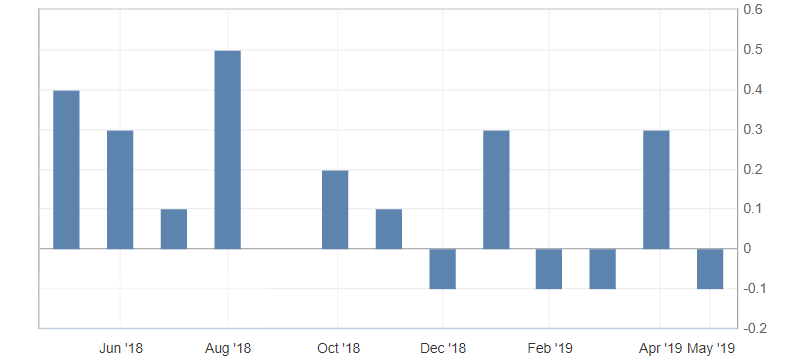
Fig. 1. Canadian GDP chart (m/m)
The USD/CAD pair updated the level of 1.3460 on weak data for Canada, but kept the downward trend on the weakness of the American dollar and the rise in oil prices. It should be noted that weak statistics on Canada and oversold on this pair may enhance the correction, causing a repeated test of resistance levels 1.3460-70. Support is located at the levels: 1.3420 and 1.3400.
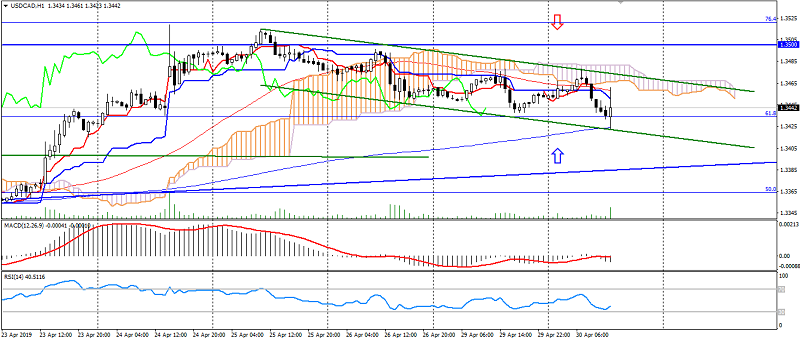
Fig. 2. USD/CAD chart. Current price – 1.3440.
Read also: “Trading – Six cases when you should refrain”
Hanzenko Anton
Earn with the help of the trade service on the news Erste News!
Topical articles of the trader’s blog:
- Sanctions against Iran, their aggravation and impact on the world market
- Multifactorial analysis of the Forex market
- Expectations from the USD/JPY for the end of April – early May
Current Investment ideas: