
New housing sales in the US
- New housing sales (Mar), fact 692K, forecast 647K.
- New housing sales (m / m) (Mar), fact of 4.5%, forecast -3.0%.
Data on new home sales in the US unexpectedly rose in March, reaching an annual maximum. This significantly reduced fears of a slowdown in the growth of the US real estate market.
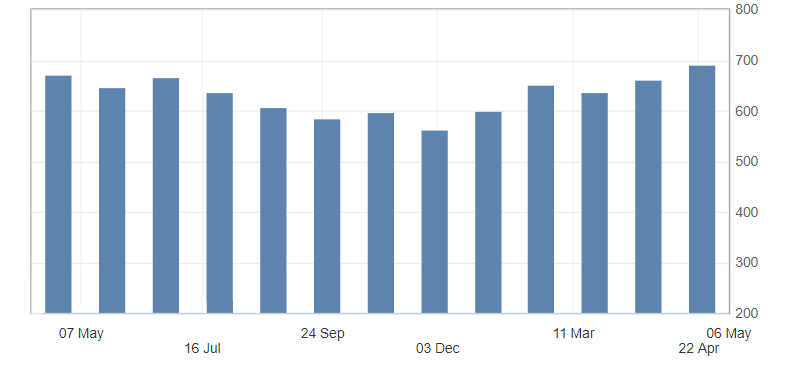
Fig. 1. New housing sales chart in the US
The US currency reacted to positive data by continuing growth against the basket of major competitors. The main strengthening of the American dollar across the market was traced before the opening of trading in the United States. The US dollar index is limited by overbought and resistance levels: 97.70 and 97.80.
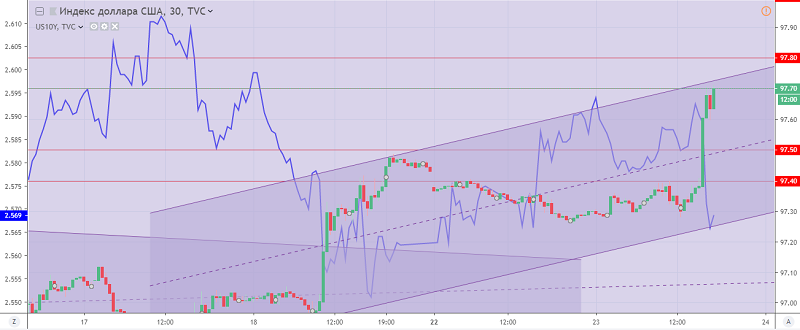
Fig. 2. The US dollar index chart. The current price is 97.70 (10-year government bonds yield is the blue line)
Read also: “Candlestick analysis. Thee main candlestick patterns”
Hanzenko Anton
Earn with the help of the trade service on the news Erste News!
Topical articles of the trader’s blog:
- Expectations from the USD/JPY for the end of April – early May
- U.S. and E.U. Trade War
- Gold: results and forecasts
Current Investment ideas: