
U.S. producer prices data
- Core Producer Price Index (PPI) (m/m) (December), fact -0.1%, forecast 0.2%.
- NY Empire State Manufacturing Activity Index (Jan), fact 3.90, forecast 10.75.
- Producer Price Index (PPI) (m/m) (December), fact -0.2%, forecast -0.1%.
The report on producer prices in the US for December has deteriorated in all key parameters. Thus, a key indicator of the producer price index (PPI) showed the maximum slowdown over the past two years, which directly indicates a decline in the consumer price index on a monthly basis.
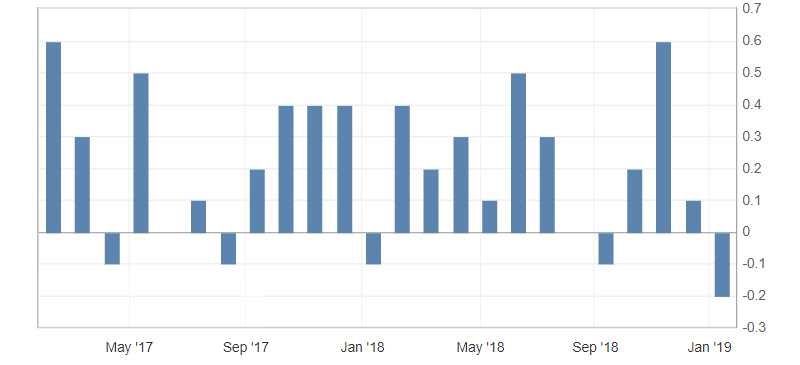
Fig. 1. U.S. producer price index (PPI) (m/m) chart
As a result, the US dollar index slowed the upward trend, which was already limited by overbought. Weak statistics on the US and stock markets attempts to grow indicate a corrective movement of the dollar index to support levels: 95.70 and 95.50. Upward dynamics on the American dollar remains, limited to resistance levels: 96.00 and 96.20
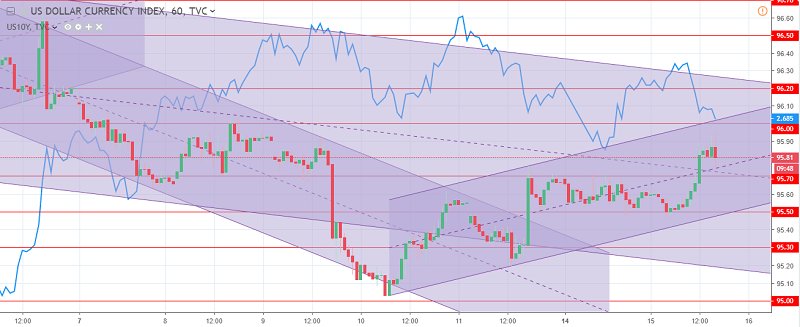
Fig. 2. The US dollar index chart. The current price is 95.80 (10-year government bonds yield is the blue line)
Hanzenko Anton
Earn with the help of the trade service on the news Erste News!
Topical articles of the trader’s blog:
- Geopolitical risks for the beginning of 2019! (Part 3)
- Long-term investment in currency pairs! The GBP/USD pair!
- Geopolitical risks for the beginning of 2019! (Part 2)
Current Investment ideas: