Technical analysis

Technical analysis of gold and silver (Alexander Sivtsov)

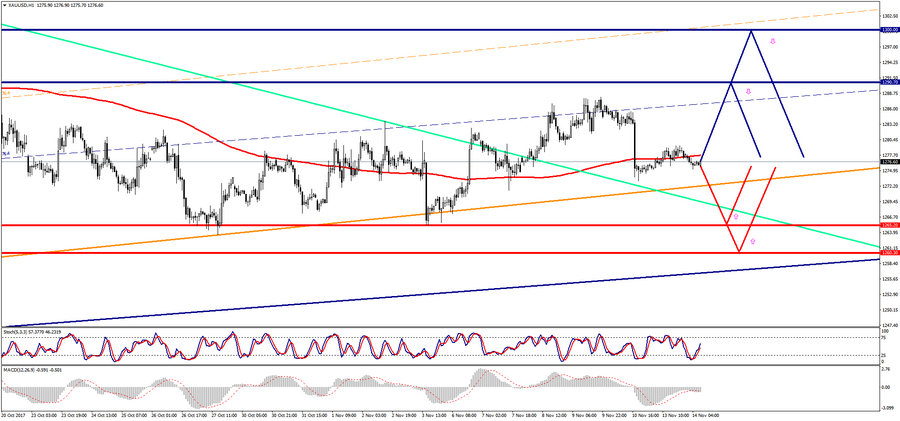
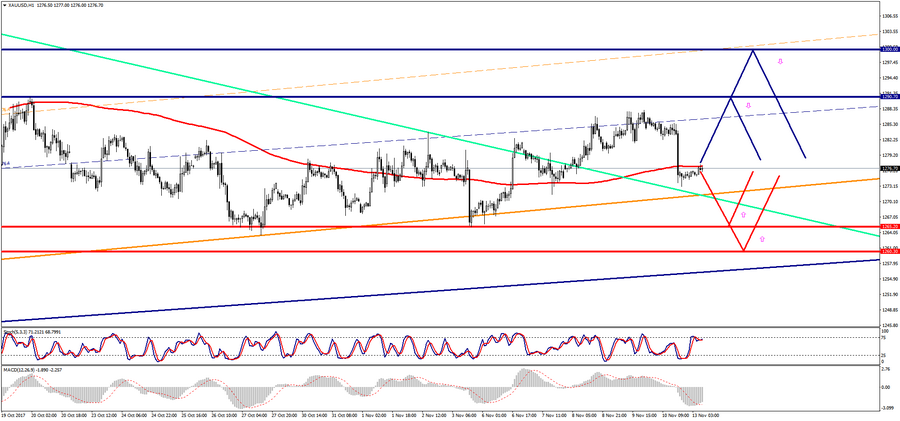
Gold chart (current price: $ 1282.20)

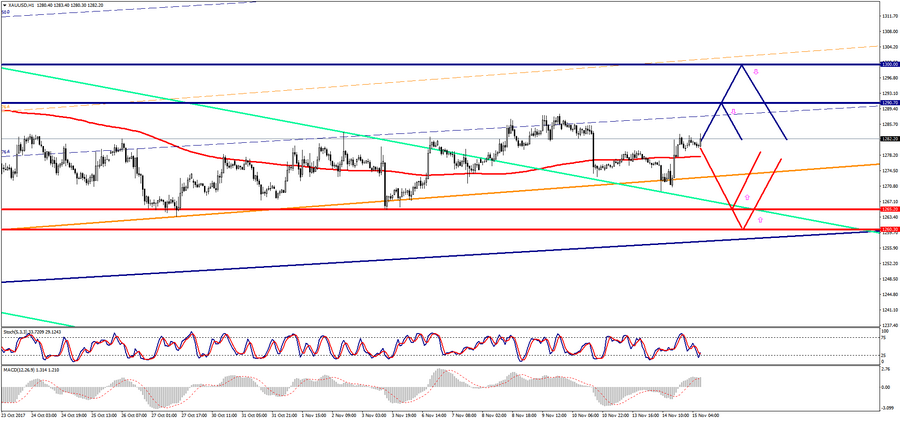
Gold is trading in a narrow range during the Asian session.

  • Resistance 1: From $ 1290.70 (October 20 maximum)
  • Resistance 2: From $ 1300.00 (psychological level)
  • Support 1: From $ 1265.20 (November 3 minimum)
  • Support 2: From $ 1260.30 (October 6 minimum)

Computer analysis: The Stochastic Oscillator movings on the chart H4 enter the overbought zone. One should expect the price of gold may decrease in the second half of the day.

Silver chart (current price: $ 17.01)

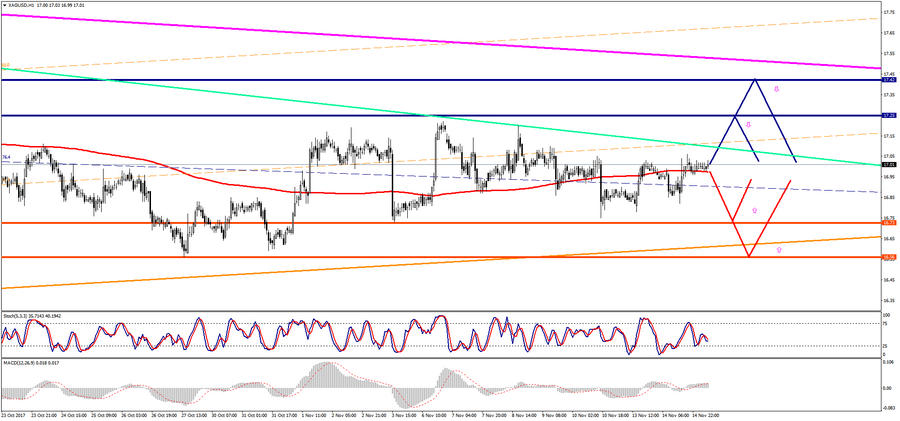
Silver is trading with a small minus during the Asian session.

  • Resistance 1: From $ 17.25 (October 20 maximum)
  • Resistance 2: From $ 17.42 (October 16 maximum)
  • Support 1: From $ 16.73 (November 3 minimum)
  • Support 2: From $ 16.56 (October 27 minimum)

Computer analysis: The Stochastic Oscillator movings on the chart H1 are in the neutral zone. One should expect the continuation of the consolidation of the silver price.

Technical analysis of cross-rates. (Anton Hanzenko)

EUR GBP (current price: 0.8970)

  • Support levels: 0.8730 (minimum of the last months), 0.8650, 0.8530.
  • Resistance levels: 0.9020, 0.9170, 0.9300 (the maximum of the current year).
  • Computer analysis: MACD (signal – downward motion): the indicator is higher than 0, the signal line has left the body of the histogram. RSI is in the overbought zone. Bollinger Bands (period 20): neutral, low volatility.

Тechnical analysis of currency pairs (Anton Hanzenko)

EUR USD (current price: 1.1680)

  • Support levels: 1.1700 (August 2015 maximum), 1.1600 (2016 maximum), 1.1470.
  • Resistance levels: 1.2000, 1.2100, 1.2270 (November 2014 minimum).
  • Сomputer analysis: CMACD (signal – upward motion): the indicator is above 0, the signal line is in the body of the histogram. RSI is in the overbought zone. Bollinger Bands (period 20): overbought, growing volatility.

Technical analysis of cross-rates. (Anton Hanzenko)

EUR GBP (current price: 0.8900)

  • Support levels: 0.8730 (minimum of the last months), 0.8650, 0.8530.
  • Resistance levels: 0.9020, 0.9170, 0.9300 (the maximum of the current year).
  • Computer analysis: MACD (signal – upward motion): the indicator is above 0, the signal line is in the body of the histogram. RSI is in the overbought zone. Bollinger Bands (period 20): overbought, growing volatility.

Тechnical analysis of currency pairs (Anton Hanzenko)

EUR USD (current price: 1.1640)

  • Support levels: 1.1700 (August 2015 maximum), 1.1600 (2016 maximum), 1.1470.
  • Resistance levels: 1.2000, 1.2100, 1.2270 (November 2014 minimum).
  • Computer analysis: MACD (signal – downward motion): the indicator is higher than 0, the signal line has left the body of the histogram. RSI is in the neutral zone. Bollinger Bands (period 20): neutral, growing volatility.