Technical Analysis of Oil (Alexander Sivtsov)
Oil is trading in a narrow range during the Asian session.
The Brent graph (current price: $ 6214.30 per 100 barrels)
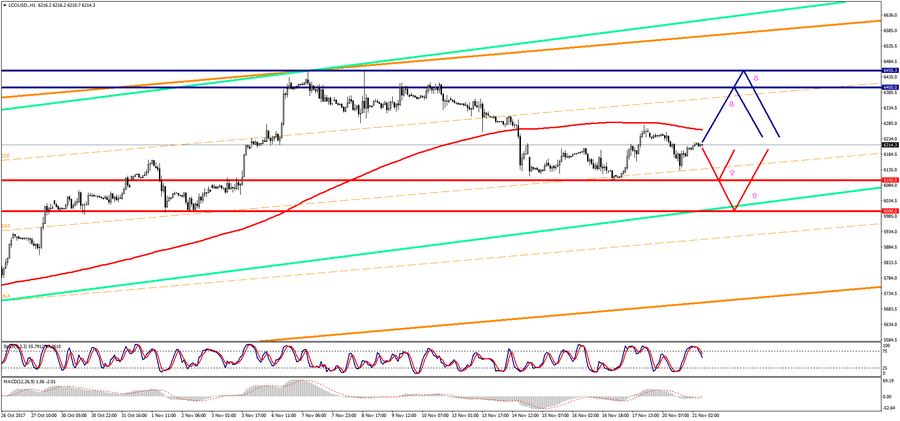
The Brent is trading just above the zero mark during the Asian session.
Oil is trading in a narrow range during the Asian session.
The Brent is trading just above the zero mark during the Asian session.
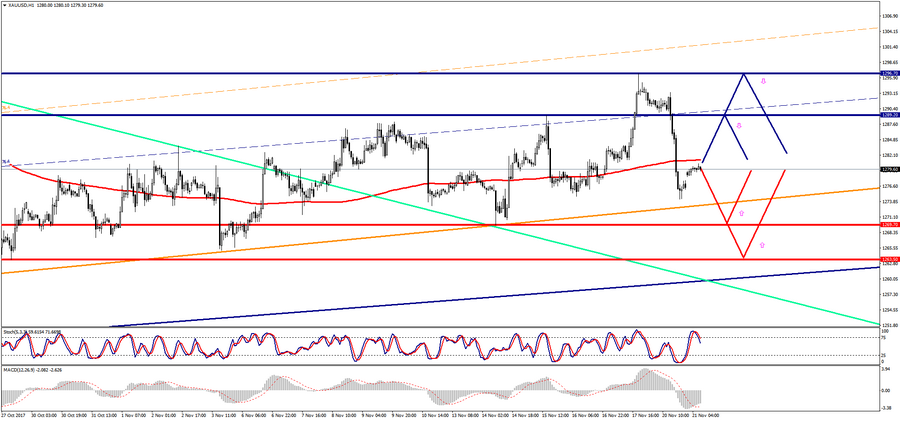
Gold is trading above the zero mark during the Asian session.
Oil is trading in a narrow range during the Asian session.
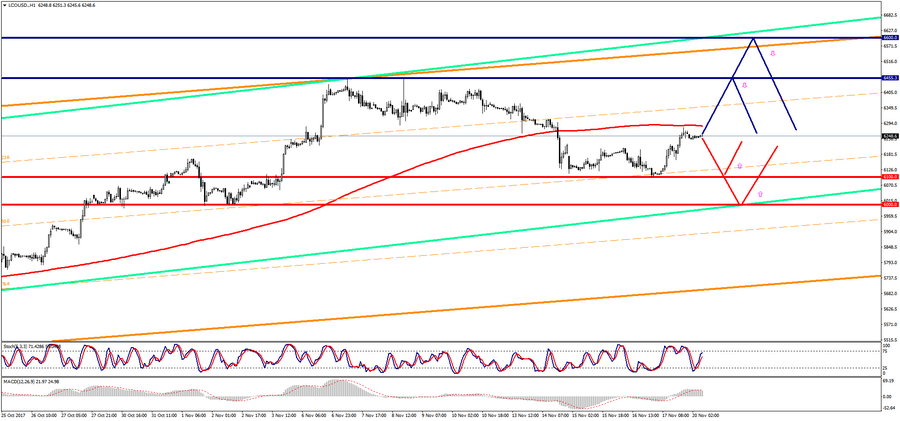
The Brent is trading just below the zero mark during the Asian session.
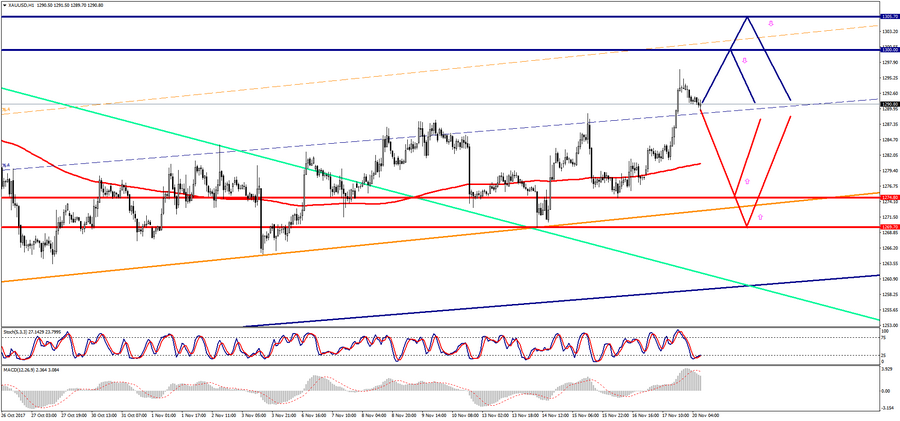
Gold is trading below the zero mark during the Asian session.

Oil shows mixed dynamics during the Asian session.
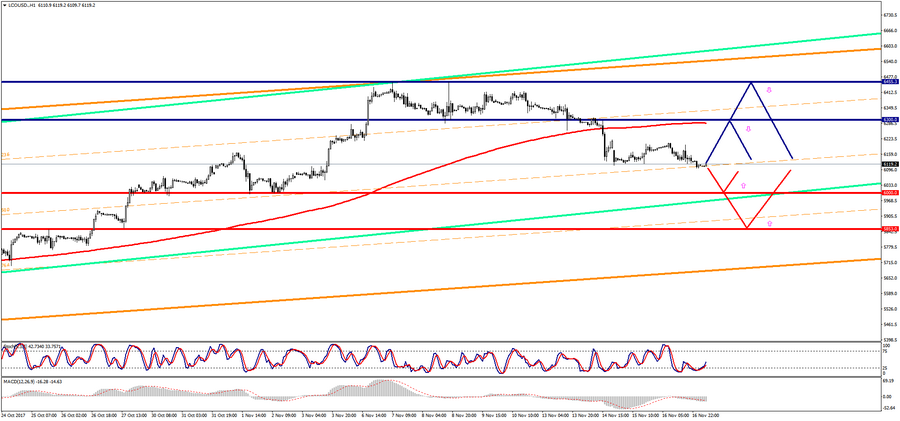
Brent is trading below the zero mark during the Asian session.