Technical Analysis of Oil (Alexander Sivtsov)
Oil is trading near zero marks during the Asian session.
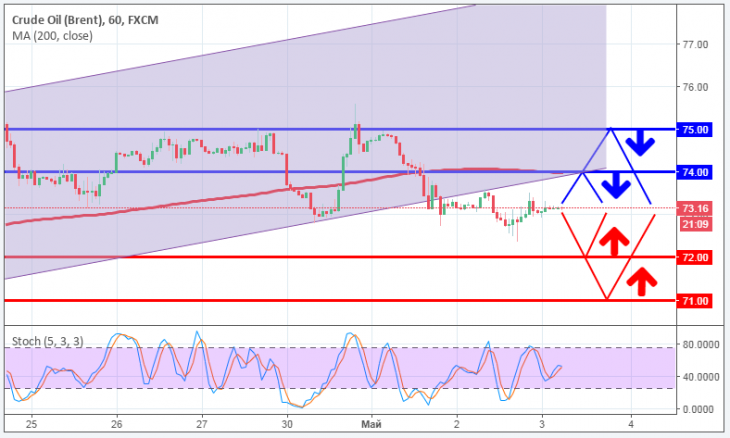
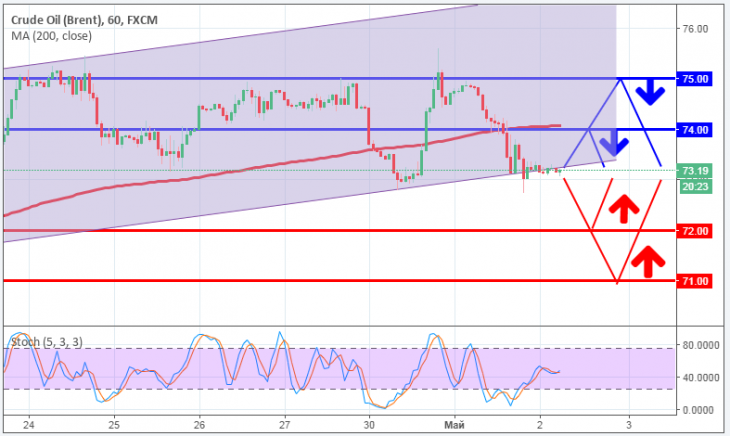
Brent chart (current price: $ 73.66)
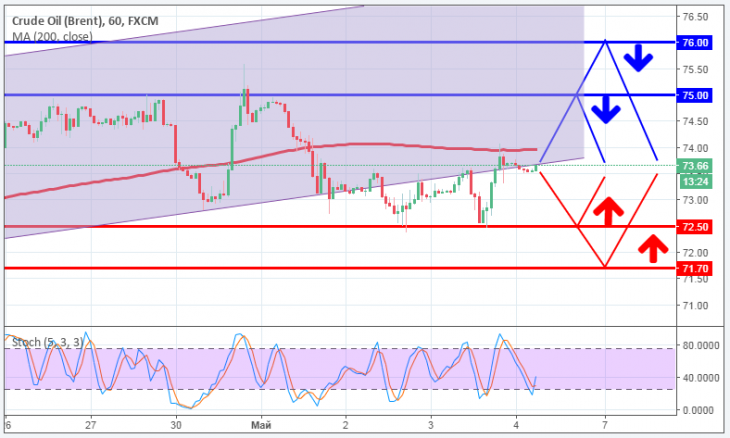
The Brent is trading near the zero mark during the Asian session.
Oil is trading near zero marks during the Asian session.
The Brent is trading near the zero mark during the Asian session.
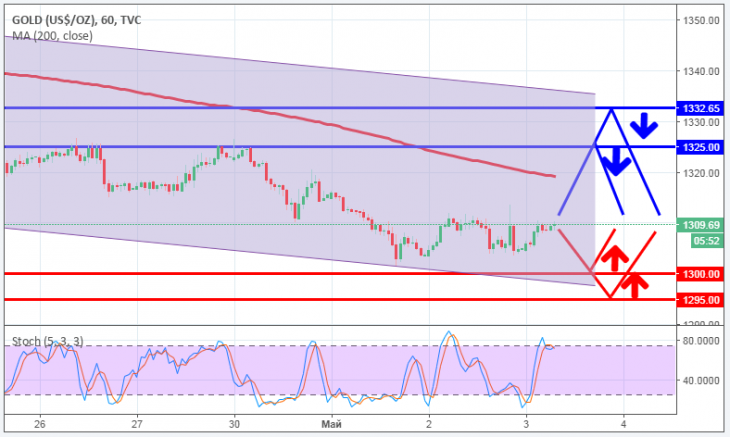
Gold is trading above the zero mark during the Asian session.
Oil shows a positive trend during the Asian session.
The Brent is trading above the zero mark during the Asian session.
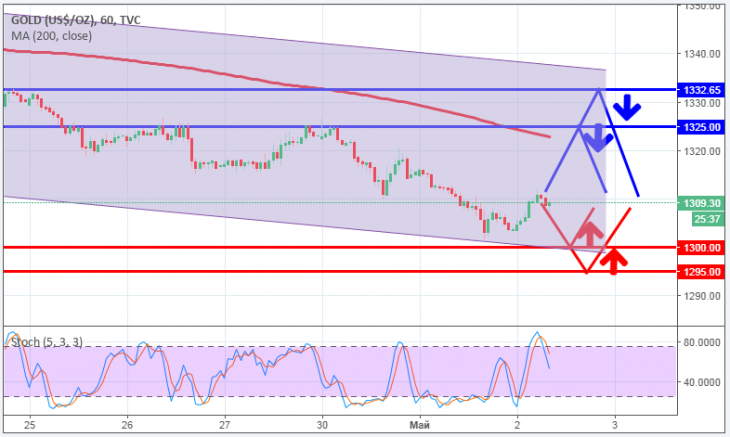
Gold is trading above the zero mark during the Asian session.
Oil shows mixed dynamics during the Asian session.
The Brent is trading near the zero mark during the Asian session.