Technical analysis

Technical analysis of gold and silver (Andre Green)

Gold chart (current price: $ 1282.00)


Gold accelerated decline on the general growth of optimism and a decrease in the demand for safe assets.

Technical analysis of oil (Dani Leviant)

Oil remains at the level of the opening day due to the expectations of the results of the OPEC meeting.

Brent chart (current price: $ 78.80)


The Brent remains in the correction phase after the breakthrough of psychology $ 80 per barrel.
Technical analysis of cross-rates. (Anton Hanzenko)

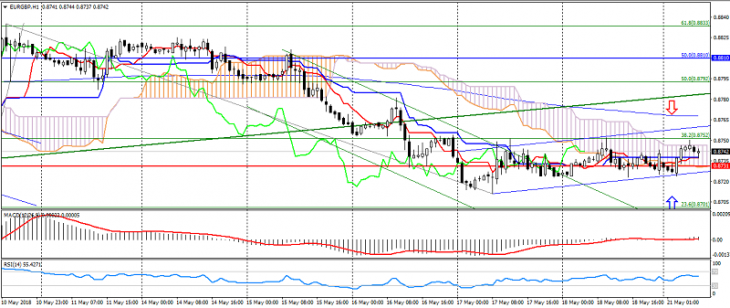
EUR GBP (current price: 0.8740)

  • Support levels: 0.8730 (minimum of the last months), 0.8650, 0.8530.
  • Resistance levels: 0.8810, 0.8900, 0.9050 (November 2016 maximum).
  • Computer analysis: MACD (12, 26, 9) (signal-flat): the indicator is near 0. RSI (14) is in the neutral zone. Ichimoku Kinko Hyo (9, 26, 52) (signal-flat): the Tenkan-sen line is near the Kijun-sen line, the price is in the cloud.

Тechnical analysis of currency pairs (Anton Hanzenko)

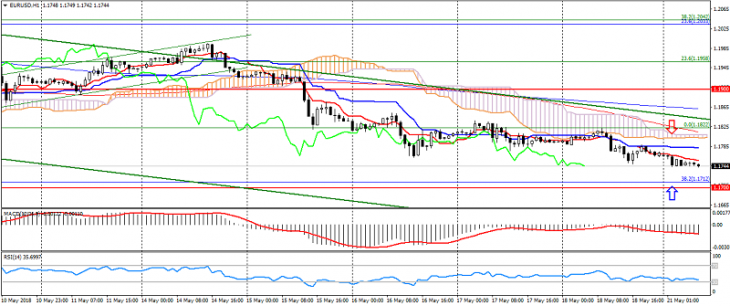
EUR USD (current price: 1.1750)

  • Support levels: 1.2100 (September-September maximum), 1.1900, 1.1700.
  • Resistance levels: 1.2600, 1.2750 (March 2013 minimum), 1.2270 (November 2014 minimum).
  • Computer analysis: MACD (12, 26, 9) (signal – downward movement): the indicator is below 0, the signal line in the body of the histogram. RSI (14) in the neutral zone. Ichimoku Kinko Hyo (9, 26, 52) (signal – downward movement): the Tenkan-sen line is below the Kijun-sen line, the price is below the cloud.

Technical analysis of gold and silver (Andre Green)

Gold chart (current price: $ 1289.00)


Gold continues to trade with a slight decrease, remaining near the lower boundary of the annual channel.

  • Resistance 1: From $ 1295.00 (technical level)
  • Resistance 2: From $ 1300.00 (psychological level)
  • Support 1: From $ 1285.00 (May 16 minimum)
  • Support 2: From $ 1280.00 (technical level)

Computer analysis: The Stochastic Oscillator movings are located in the neutral zone, preserving the uncertainty of gold.

Silver chart (current price: $ 16.42)


Silver remains in a general downward trend and maintains an established trading range.

  • Resistance 1: From $ 16.40 (technical level)
  • Resistance 2: From $ 16.60 (technical level)
  • Support 1: From $ 16.20 (technical level)
  • Support 2: From $ 16.00 (May minimum)

Computer analysis: The Stochastic Oscillator movings are in the neutral zone, despite the corrective movement.

Technical analysis of oil (Dani Leviant)

Oil remains at the opening level of the day, correcting after the next update of the maximum.

Brent chart (current price: $ 79.50)


The Brent went into the correction phase after breaking through psychology at $ 80 per barrel.

  • Resistance 1: From $ 80.00 (psychological maximum)
  • Resistance 2: From $ 80.50 (Thursday maximum)
  • Support 1: From $ 79.00 (psychological level)
  • Support 2: From $ 78.50 (technical level)

Computer analysis: The Stochastic Oscillator movings are in the neutral zone and are traded downward in anticipation of further growth in the cost of oil.

WTI chart (current price: $ 71.60)


The WTI brand is also traded in flat, thereby adjusting itself after growth.

  • Resistance 1: From $ 72.00 (psychological level)
  • Resistance 2: From $ 72.50 (technical level)
  • Support 1: From $ 71.00 (psychological level)
  • Support 2: From $ 70.50 (May 16 minimum)

Computer analysis: The Stochastic Oscillator movings are in the neutral zone, indicating the unloading of the indicator and opening the possibility for growth.
Technical analysis of cross-rates. (Anton Hanzenko)

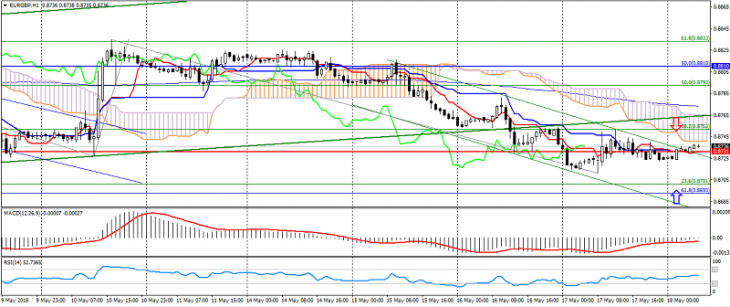
EUR GBP (current price: 0.8730)

  • Support levels: 0.8730 (minimum of the last months), 0.8650, 0.8530.
  • Resistance levels: 0.8810, 0.8900, 0.9050 (November 2016 maximum).
  • Computer analysis: MACD (12, 26, 9) (signal – upward movement): the indicator is below 0, the signal line has left the body of the histogram. RSI (14) is in the neutral zone. Ichimoku Kinko Hyo (9, 26, 52) (signal – downward movement): the Tenkan-sen line is below the Kijun-sen line, the price is below the cloud.

Тechnical analysis of currency pairs (Anton Hanzenko)

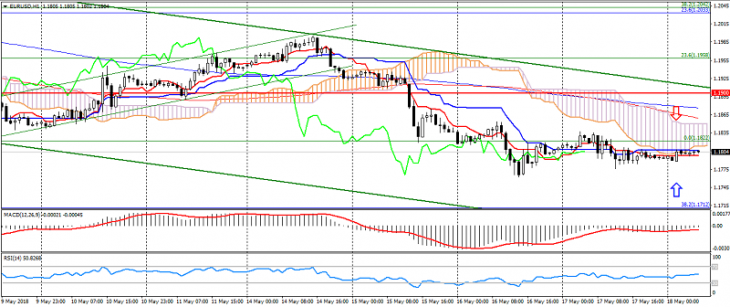
EUR USD (current price: 1.1800)

  • Support levels: 1.2100 (September 2017 maximum), 1.1900, 1.1700.
  • Resistance levels: 1.2600, 1.2750 (March 2013 minimum), 1.2270 (November 2014 minimum).
  • Computer analysis: MACD (12, 26, 9) (signal-flat): the indicator is near 0. RSI (14) is in the neutral zone. Ichimoku Kinko Hyo (9, 26, 52) (signal – downward movement): the Tenkan-sen line is below the Kijun-sen line, the price is below the cloud.

Technical analys of gold and silver (Anton Hanzenko)

Gold chart (current price: $ 1289.00)


Gold, after the decline, remains in the sideways trend near the lower border of the trading channel.