
Candlestick analysis. The main candlestick patterns. Part 2. Alexander Sivtsov.
In the first part of this series of articles, we met with such patterns as doji and spinning top, the formation of which is a strong signal for the reversal of the current trend in the market. In this article we will look at candlestick patterns, which are also considered as a signal of price reversal in the market: the hanging man and the hammer.
Hanging Man and Hammer
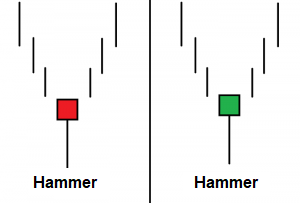
The hanging man and the hammer are candlesticks with a small body and a long lower shadow, which at least should be twice as long as the body of the candlestick. It is also noteworthy that the color of the candlestick’s body does not matter while creating these patterns. The main difference between the hanging and the hammer are the conditions of its formation.
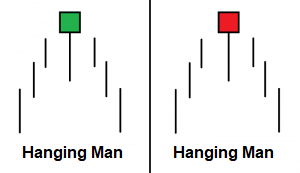 The hammer is formed during the downward price movement, its formation on the chart indicates the weakening of the strength of the bears and the soon changing trend in the market.
In turn, the hanging man is formed only with upward price movement in the market. Like the hammer, the hanging man signals the fading of the current trend, but in this case we are talking about bulls and weakening their power in front of the bears.
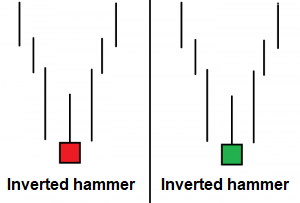
Shooting Star and Inverted Hammer
Candlestick shooting star and inverted hammer models also belong to reversal candlestick patterns and are a strong signal to change the price direction in the market. Like previous models, the shooting star and the inverted hammer have a small candle body and only one shadow, but in this case the shadow is directed not downwards, but upwards.
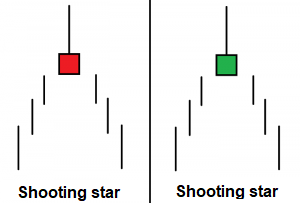
A shooting star is forming with an upward trend and signals that the strength of bulls is no longer enough to push the price higher and soon bears can seize the initiative in the market.
An inverted hammer is formed by a downward movement of prices on the market and suggests that bears are not enough to exert further pressure on the price of the tool and soon we can expect that the market situation will change in favor of the bulls.
It is worth remembering that the formation of reversal candlestick patterns in the market is not a 100 percent signal for price reversal in the opposite direction. Candlestick patterns are more significant at the time of the formation of new highs or lows on the chart. Also, do not forget that any formed candlestick pattern requires a confirmation signal, which is the additional formation of one or more candlesticks in the right direction.
If you want to learn more about trading on the market using candlestick analysis and the formation of various candlestick patterns, get training from European class experts in Еster Holdings Inc.
Alexander Sivtsov