
U.S. data
- Employment Cost Index (q/q) (Q4), fact 0.7%, forecast 0.8%.
- Initial jobless claims, fact 253K, forecast 215K.
Preliminary employment data in the United States turned out to be very weak before the Friday employment report in the United States. The number of initial applications for unemployment benefits showed a particularly negative trend, which unexpectedly increased to the highest values of January 2018, significantly reducing optimism about the growth in the US employment for the month.
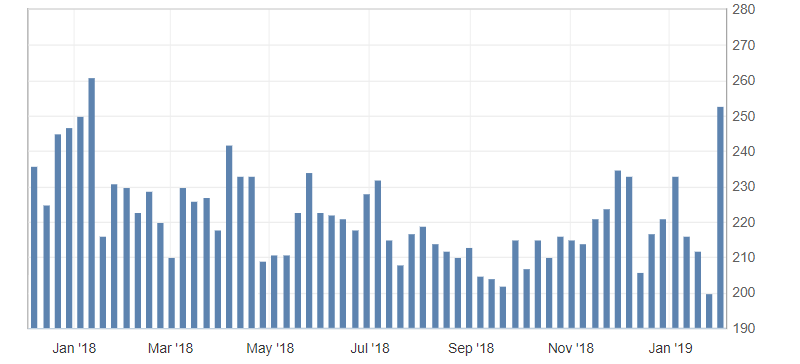
Fig. 1. U.S. initial jobless claims chart
The US dollar index also reacted with a moderate decline to these statistics, slowing the upward correction and returning the dollar to a downward trend, which is limited by the oversoldness of the American dollar. Therefore, the formation of a side channel near the lows is possible. Support levels: 95.20 and 95.00, resistance: 95.40 and 95.60.
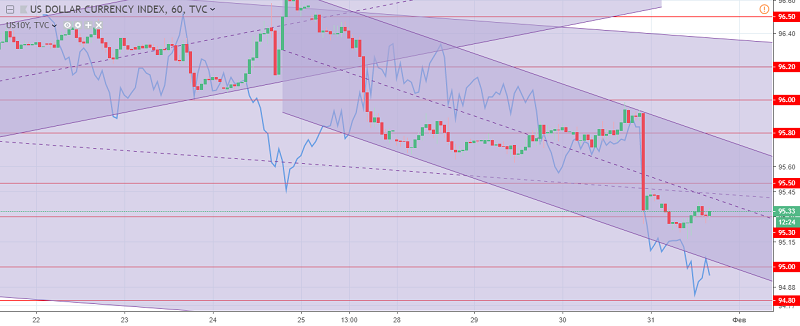
Fig. 2. The US dollar index chart. The current price is 95.30 (10-year government bonds yield is the blue line)
Read also: “Strategy Fork – Try it, You’ll Like It”
Andre Green
Earn with the help of the trade service on the news Erste News!
Topical articles of the trader’s blog:
- The World Forum: Davos 2019. Globalization is under threat!
- Long-term investment in currency pairs! The USD/DKK pair!
- Another “Top 5” books on trading. It can’t be too much information!
Current Investment ideas: