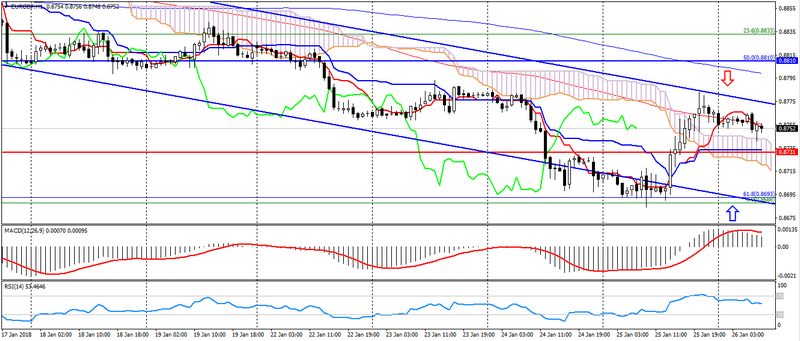
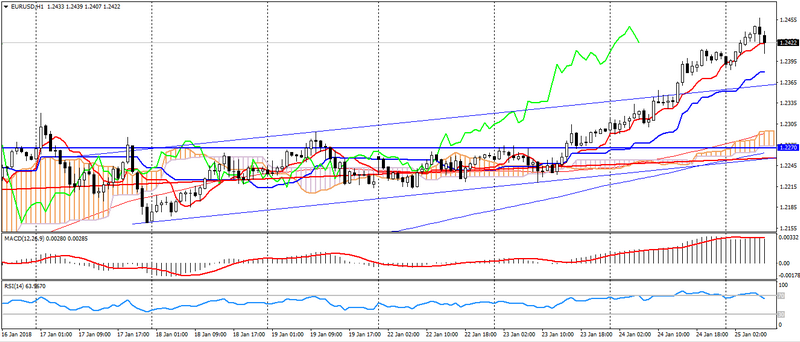
EUR USD (current price: 1.2450)
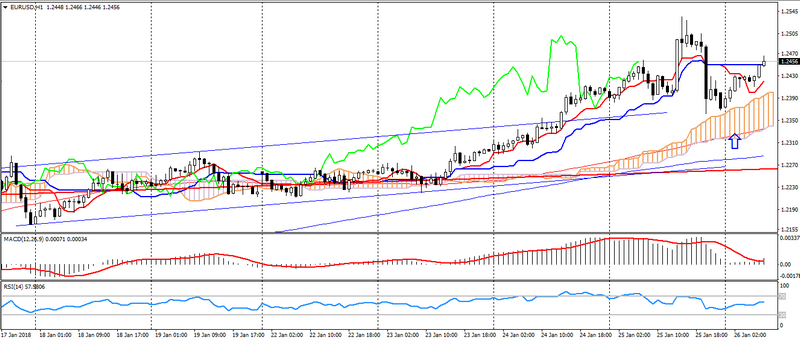
- Support levels: 1.2100 (September-September maximum), 1.1900, 1.1700.
- Resistance levels: 1.2600, 1.2750 (March 2013 minimum), 1.2270 (November 2014 minimum).
- Computer analysis: MACD (12,26,9) (signal-upward movement): the indicator is above 0, the signal line is in the body of the histogram. RSI (14) is in the neutral zone. IchimokuKinkoHyo (9,26,52) (signal – upward movement) : the Tenkan-sen line is above the Kijun-sen line, the price is higher than the cloud.
- The main recommendation: sale entry is started from 1.2500, 1.2520, 1.25500.
- Alternative recommendation: buy entry is started from 1.2390, 1.2350, 1.2310.
The euro keeps growing momentum, despite Trump’s comments on the strong dollar, which is caused by the continued optimism after the ECB meeting.
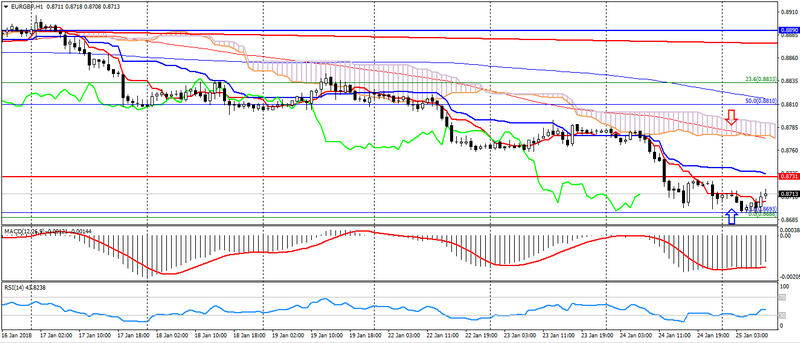
GBP USD (current price: 1.4240)
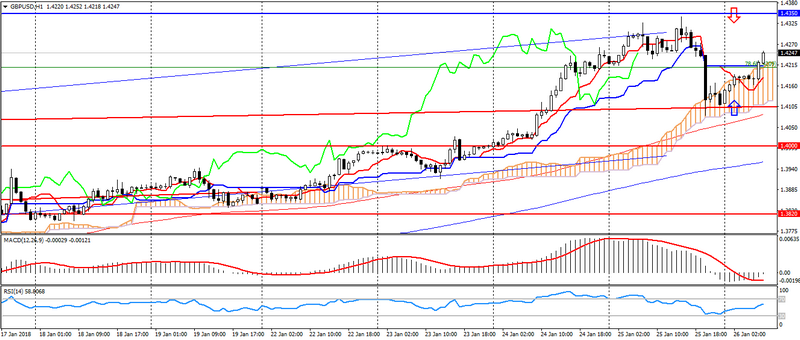
- Support levels: 1.4000 (April 2016 minimum), 1.3820, 1.3650 (September 2017 maximum).
- Resistance levels: 1.43500, 1.4500, 1.4750 (May May 2016 maximum).
- Computer analysis: MACD (12.26.9) (signal – upward movement): the indicator is below 0, the signal line has left the histogram bar. RSI (14) is in the neutral zone. IchimokuKinkoHyo (9,26,52) (signal-downward movement) : the Tenkan-sen line is below Kijun-sen, the price is higher than the cloud.
- The main recommendation: sale entry is started from 1.4320, 1.4350, 1.4370.
- Alternative recommendation: buy entry is started from 1.4200, 1.4150, 1.4130.
The British pound is also traded with the strengthening after the decline, keeping growth against the American.
USD CHF (current price: 0.9360)
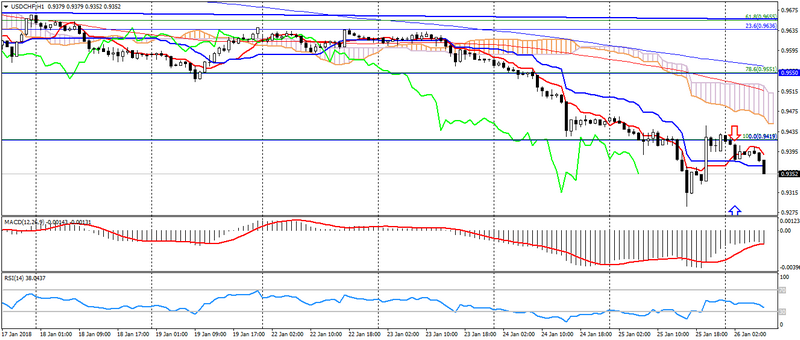
- Support levels: 0.9250 (August 2015 minimum), 0.9150, 0.9050 (May 2015 minimum).
- Resistance levels:, 0.9550, 0.9800, 1.0030 (November 2017 maximum).
- Computer analysis: MACD (12,26,9) (signal – downward movement): the indicator is below 0, the signal line is in the body of the histogram. RSI (14) is in the neutral zone. IchimokuKinkoHyo (9,26,52) (signal – downward movement): the Tenkan-sen line is below the Kijun-sen line, the price is below the cloud.
- The main recommendation: sale entry is started from 0.9430, 0.9480, 0.9500.
- Alternative recommendation: buy entry is started from 0.9310, 0.9280, 0.9250.
The Swiss franc maintains an upward trend, despite a rapid correction.
USD JPY (current price: 108.90)
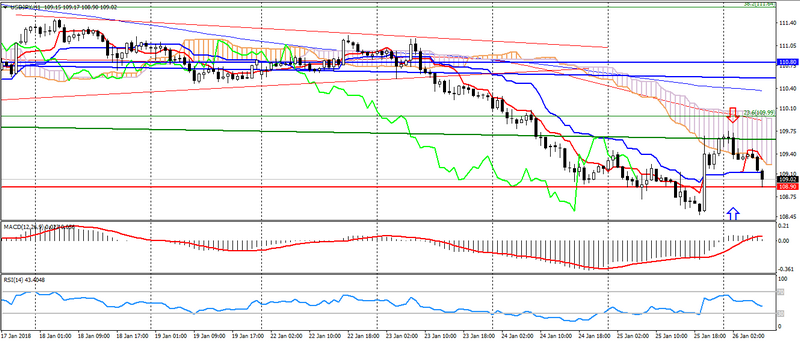
- Support levels: 108.90, 108.10 (April 2017 minimum), 107.30 (2017 minimum).
- Resistance levels: 110.80, 111.70 (October 2017 minimum), 113.70.
- Computer analysis: MACD (12, 26, 9) (signal – flat): the indicator is near 0. RSI (14) is in the neutral zone. IchimokuKinkoHyo (9,26,52) (signal – upward movement, flat): the Tenkan-sen line is above the Kijun-sen line, the price is below the cloud.
- The main recommendation: sale entry is started from 109.40, 109.70, 110.00.
- Alternative recommendation: buy entry is started from 108.90, 108.60, 108.40.
The Japanese yen maintains a sideways trend after weak inflation data in Japan, remaining a limited to a significant oversold.
USD CAD (current price: 1.2320)
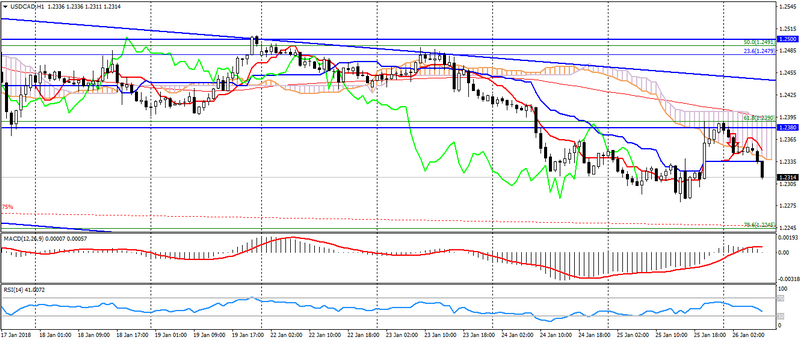
- Support levels: 1.2200, 1.2060 (2017 minimum), 1.1950 (2015 minimum).
- Resistance levels: 1.2380, 1.2500, 1.2650.
- Computer analysis: MACD (12, 26, 9) (signal – downward movement): the indicator is above 0, the signal line has left the histogram bar. RSI (14) is in the neutral zone. IchimokuKinkoHyo (9,26,52) (signal – downward movement): the Tenkan-sen line is above the Kijun-sen line, the price is below the cloud.
- The main recommendation: sale entry is started from 1.2350, 1.2380, 1.2400.
- Alternative recommendation: buy entry is started from 1.2300, 1.2280, 1.2250.
The Canadian dollar maintains an upward trend, helped by the positive dynamics of oil.
AUD USD (current price: 0.8080)
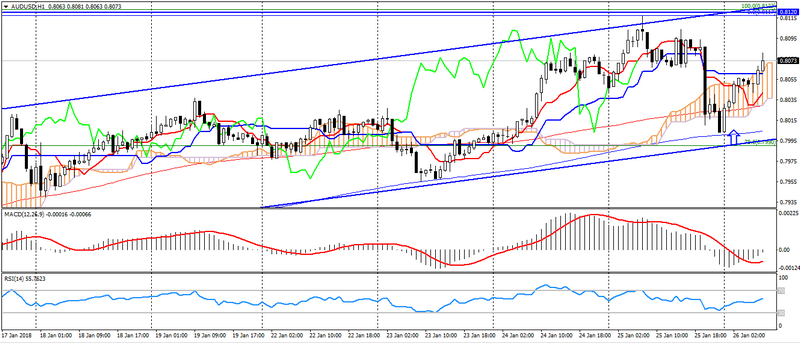
- Support levels: 0.7900, 0.7700 (March 2017 maximum), 0.7500.
- Resistance levels: 0.8120 (2017 maximum), 0.8200, 0.8290 (2014 maximum).
- Computer analysis: MACD (12, 26, 9) (signal – upward movement): the indicator is below 0, the signal line has left the body of the histogram. RSI (14) in the neutral zone. IchimokuKinkoHyo (9,26,52) (signal – downward movement): the line Tenkan-sen is below the line Kijun-sen, the price is in the cloud.
- The main recommendation: sale entry is started from 0.8090, 0.8120, 0.8150.
- Alternative recommendation: buy entry is started from 0.8050, 0.8030, 0.8000.
The Australian also resumed after the recovery of the American, but still the pair maintains an ascending, well-established trend.
NZD USD (current price: 0.7360)
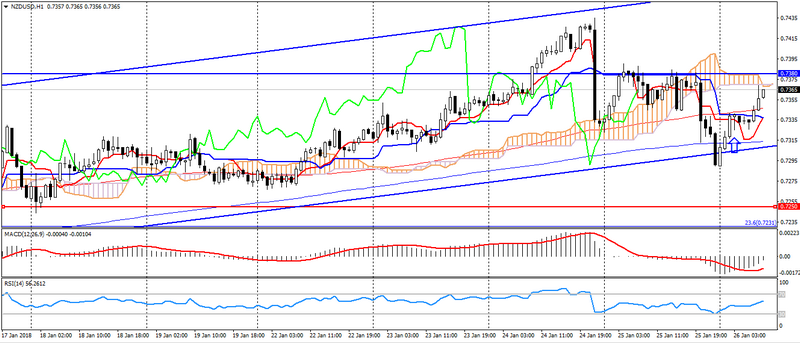
- Support levels: 0.7250, 0.7130 (August 2017 minimum), 0.7000.
- Resistance levels: 0.7380, 0.7450, 0.7550 (2017 maximum).
- Computer analysis: MACD (12, 26, 9) (signal-outflow): the indicator is above 0, the signal line has left the body of the histogram. RSI (14) in the neutral zone. IchimokuKinkoHyo (9,26,52) (signal – downward movement): the Tenkan-sen line is below the Kijun-sen line, the price is higher than the cloud.
- The main recommendation: sale entry is started from 0.7380, 0.7410, 0.7440.
- Alternative recommendation: buy entry is started from 0.7330, 0.7310, 0.7290.
The New Zealand dollar is also traded with a strengthening due to the uptrend.
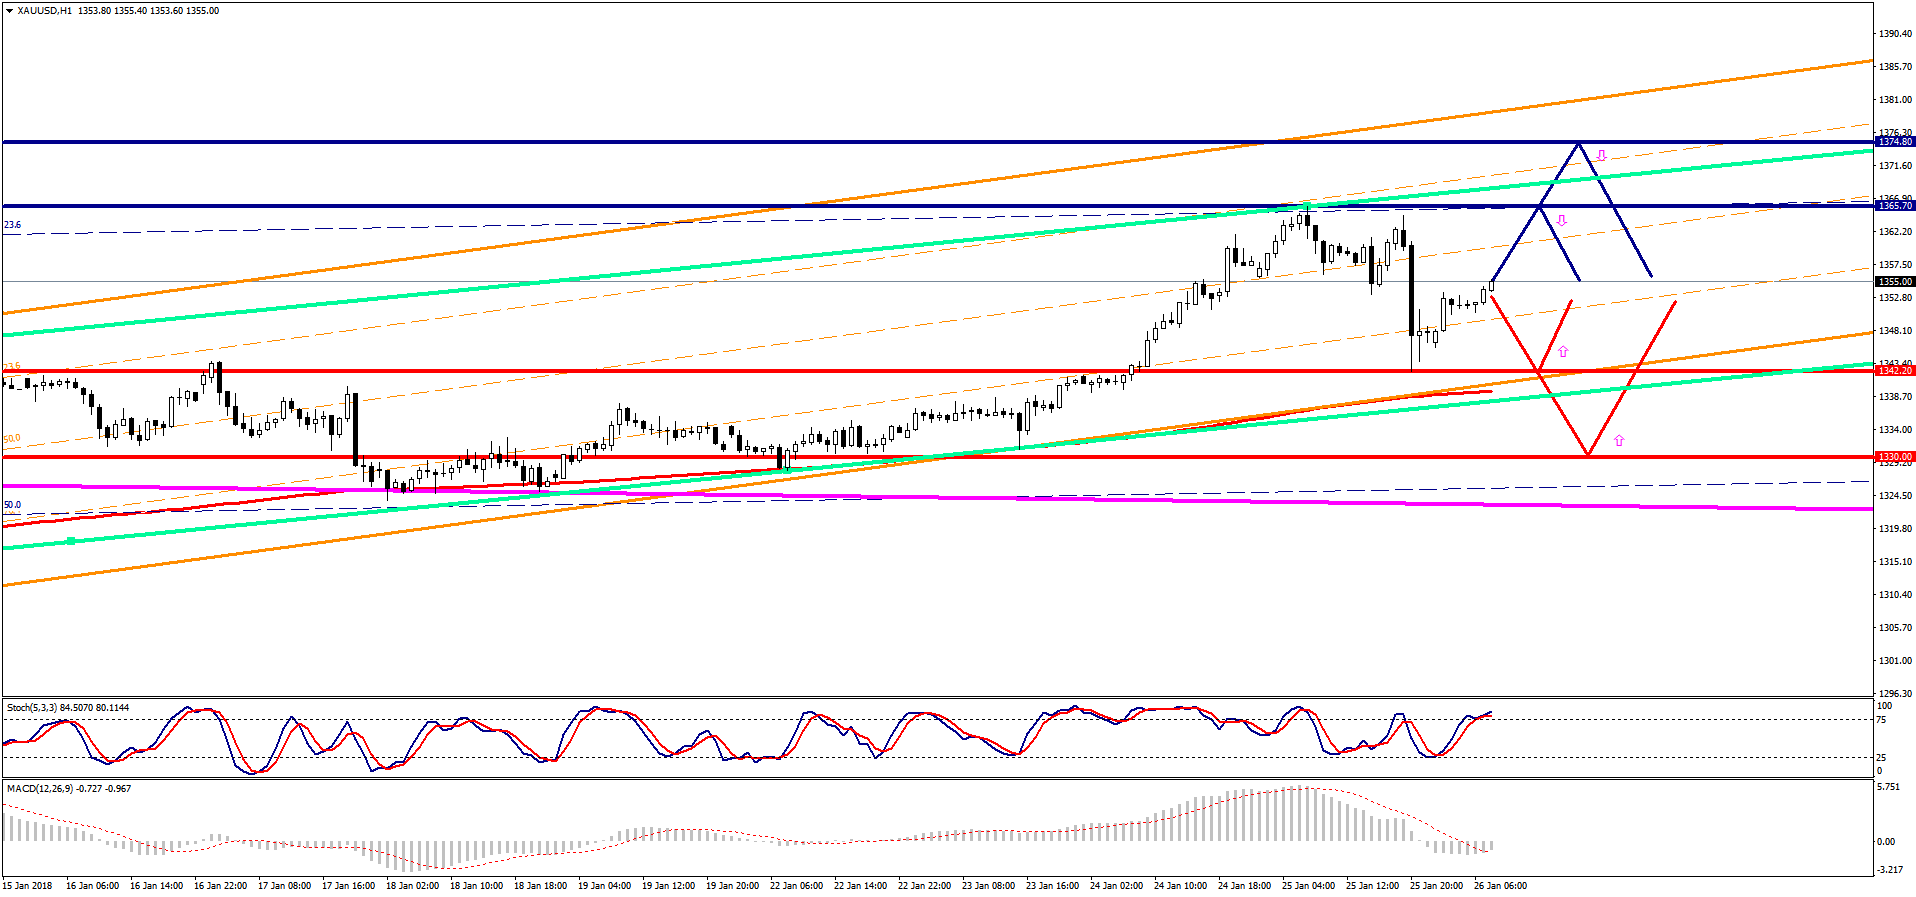
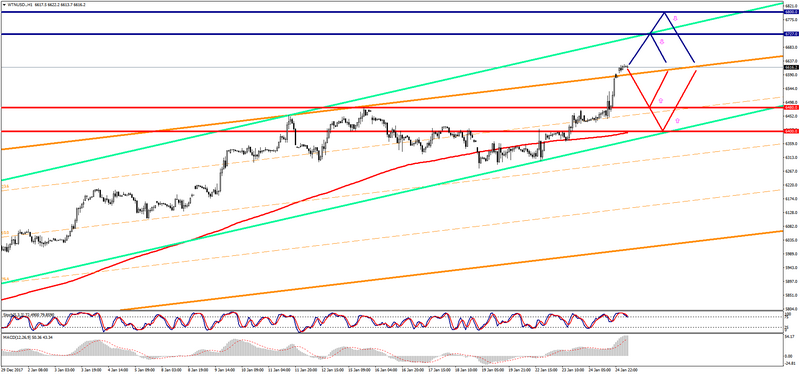
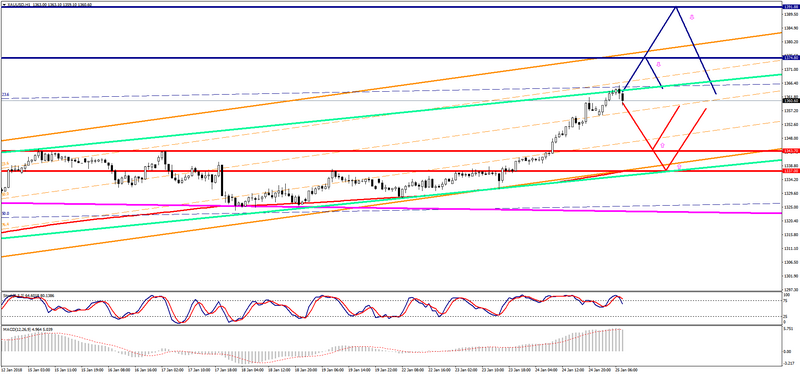
XAU USD (current price: 1356.00)
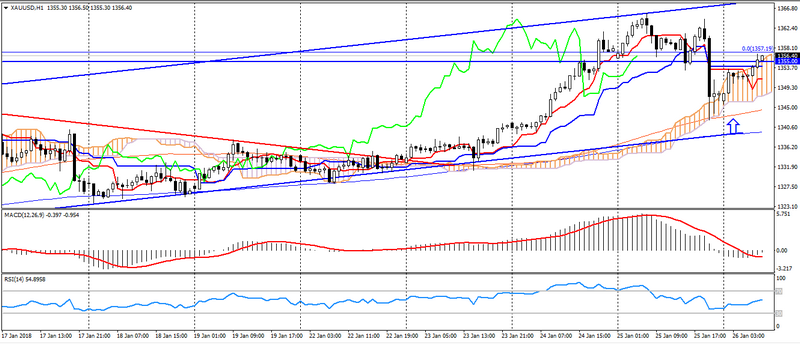
- Support levels: 1320.00, 1303.00, 1200.00.
- Resistance levels: 1340.00, 1355.00 (May 2016 maximum), 1285.00 (March 2016 maximum).
- Computer analysis: MACD (12, 26, 9) (signal – upward movement): the indicator is below 0, the signal line has left the body of the histogram. RSI (14) is in the neutral zone. IchimokuKinkoHyo (9,26,52) (signal-going traffic): the Tenkan-sen line is below the Kijun-sen line, the price is higher than the cloud.
- The main recommendation: sale entry is started from 1362.00, 1366.00, 1372.00.
- Alternative recommendation: buy entry is started from 1348.00, 1345.00, 1340.00.
Gold is under pressure, maintaining an upward trend.