Тechnical analysis of currency pairs (Anton Hanzenko)
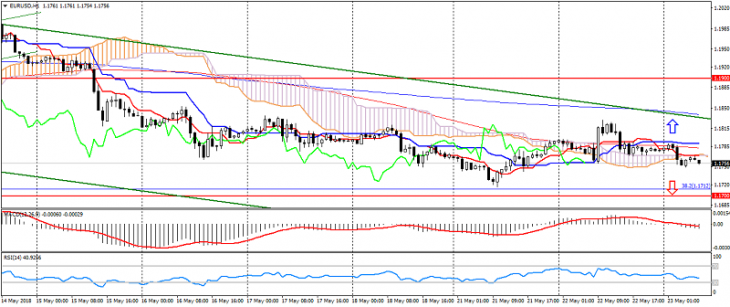
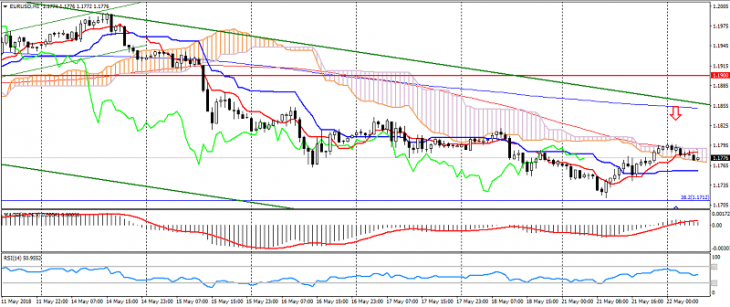
EUR USD (current price: 1.1700)
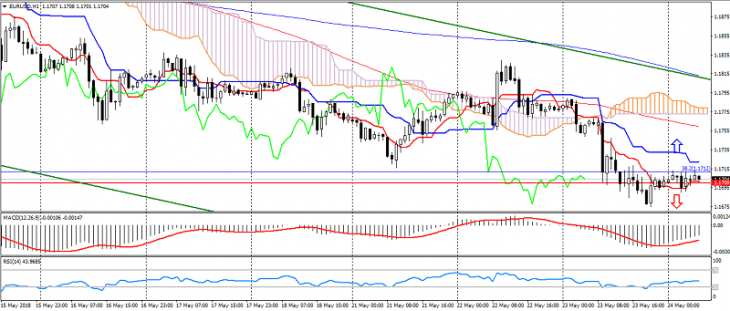
- Support levels: 1.2100 (September 2017 maximum), 1.1900, 1.1700.
- Resistance levels: 1.2600, 1.2750 (March 2013 minimum), 1.2270 (November 2014 minimum).
- Computer analysis: MACD (12, 26, 9) (signal – downward movement): the indicator is below 0, the signal line is below the body of the histogram. RSI (14) is in the neutral zone. Ichimoku Kinko Hyo (9, 26, 52) (signal – downward movement): the Tenkan-sen line is below the Kijun-sen line, the price is below the cloud.