Technical analysis

Technical analysis of oil (Dani Leviant)

Oil is traded flat in anticipation of data on changes in quotas for oil production.

Brent chart (current price: $ 75.30)


The Brent is traded near the local bottom, thereby unloading oversold indicators.
Technical analysis of cross-rates. (Anton Hanzenko)

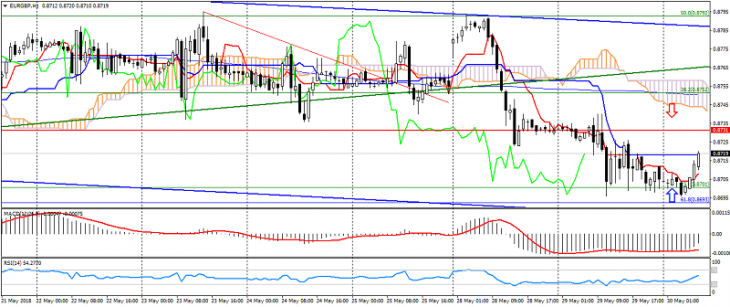
EUR GBP (current price: 0.8720)

  • Support levels: 0.8730 (minimum of the last months), 0.8650, 0.8530.
  • Resistance levels: 0.8810, 0.8900, 0.9050 (November 2016 maximum).
  • Computer analysis: MACD (12, 26, 9) (signal – upward movement): the indicator is below 0, the signal line has left the body of the histogram. RSI (14) is in the neutral zone. Ichimoku Kinko Hyo (9, 26, 52) (signal – downward movement): the Tenkan-sen line is below the Kijun-sen line, the price is below the cloud.

Тechnical analysis of currency pairs (Anton Hanzenko)

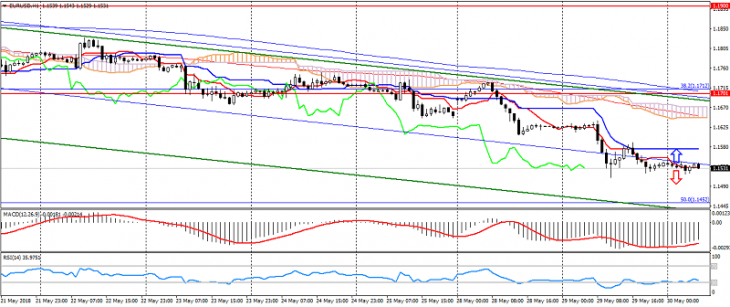
EUR USD (current price: 1.1530)

  • Support levels: 1.2100 (September 2017 maximum), 1.1900, 1.1700.
  • Resistance levels: 1.2600, 1.2750 (March 2013 minimum), 1.2270 (November 2014 minimum).
  • Computer analysis: MACD (12, 26, 9) (signal – upward movement): the indicator is below 0, the signal line has left the body of the histogram. RSI (14) is in the oversold zone. Ichimoku Kinko Hyo (9, 26, 52) (signal – downward movement): the Tenkan-sen line is below the Kijun-sen line, the price is below the cloud.

Technical analysis of gold and silver (Andre Green)

Gold chart (current price: $ 1296.00)


Gold is traded in flat due to the uncertainty regarding the downtrend.

Technical analysis of oil (Dani Leviant)

Oil slowed down on technical correction and expectations for new drivers.

Brent chart (current price: $ 75.50)


The Brent found support at the highs of April while remaining under pressure of risks.
Technical analysis of cross-rates. (Anton Hanzenko)

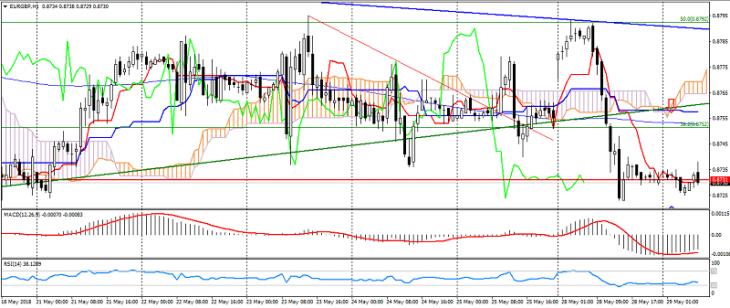
EUR GBP (current price: 0.8730)

  • Support levels: 0.8730 (minimum of the last months), 0.8650, 0.8530.
  • Resistance levels: 0.8810, 0.8900, 0.9050 (November 2016 high).
  • Computer analysis: MACD (12, 26, 9) (signal – upward movement): the indicator is below 0, the signal line has left the body of the histogram. RSI (14) in the zone of easy overselling. Ichimoku Kinko Hyo (9, 26, 52) (signal – downward movement): the Tenkan-sen line is below the Kijun-sen line, the price is below the cloud.

Тechnical analysis of currency pairs (Anton Hanzenko)

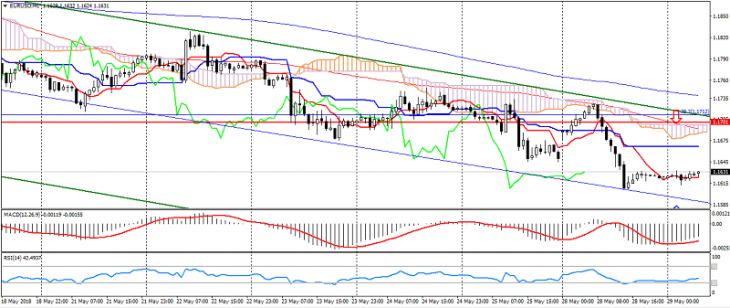
EUR USD (current price: 1.1630)

  • Support levels: 1.2100 (September-September maximum), 1.1900, 1.1700.
  • Resistance levels: 1.2600, 1.2750 (March 2013 minimum), 1.2270 (November 2014 minimum).
  • Computer analysis: MACD (12, 26, 9) (signal – upward movement): the indicator is below 0, the signal line has left the body of the histogram. RSI (14) in the neutral zone. Ichimoku Kinko Hyo (9, 26, 52) (signal – downward movement): the Tenkan-sen line is below the Kijun-sen line, the price is below the cloud.

Technical analysis of gold and silver (Andre Green)

Gold chart (current price: $ 1296.00)


Gold is under pressure at the beginning of the day on the resumption of optimism in the stock markets, but at the same time limited to last week’s lows.

Technical analysis of oil (Dani Leviant)

Oil continued to decline at the beginning of the week due to the risks over increase of oil production in OPEC and the growth of drilling activity in the US.

Brent chart (current price: $ 75.60)


The Brent brand remains under pressure from risks associated with a possible increase in oil production, but is limited to April highs.