
Тechnical analysis of currency pairs (Anton Hanzenko)
EUR USD (current price: 1.2260)
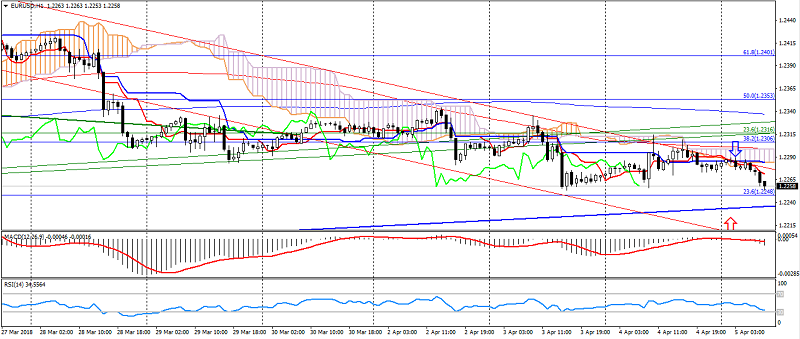
- Support levels: 1.2100 (September 2017 maximum), 1.1900, 1.1700.
- Resistance levels: 1.2600, 1.2750 (March 2013 minimum), 1.2270 (November 2014 minimum).
- Computer analysis: MACD (12,26,9) (signal – downward movement): the indicator is below 0, the signal line is in the body of the histogram. RSI (14) is in the neutral zone. IchimokuKinkoHyo (9,26,52) (signal- downward movement): the Tenkan-sen line is below the Kijun-sen line, the price is below the cloud.
- The main recommendation: sale entry is started from 1.2300, 1.2330, 1.2360.
- Alternative recommendation: buy entry is started from 1.2240, 1.2220, 1.2200.
The pair accelerated the decline on the growth of optimism about the dollar, which was caused by the lowering of the risks of the trade war.
GBP USD (current price: 1.4050)
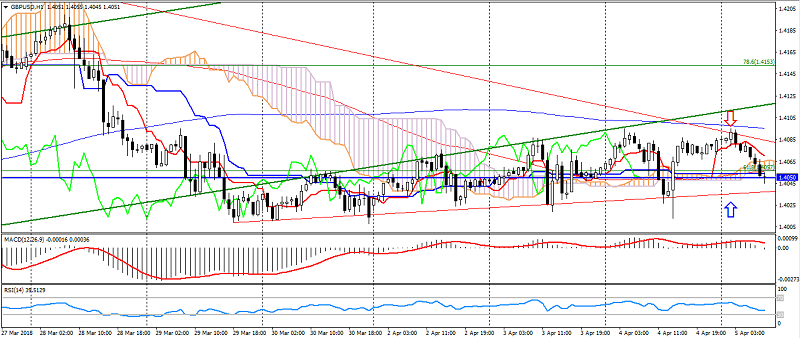
- Support levels: 1.3820,1.3650 (September 2017 maximum), 1.3450.
- Resistance levels: 1.4050, 1.4350, 1.4500.
- Computer analysis: MACD (12,26,9) (signal – downward movement): the indicator is higher than 0, the signal line has left the body of the histogram. RSI (14) is in the neutral zone. IchimokuKinkoHyo (9,26,52) (signal – upward movement, flat): the Tenkan-sen line above the Kijun-sen line, the price is below the cloud.
- The main recommendation: sale entry is started from 1.4080, 1.4100, 1.4130.
- Alternative recommendation: buy entry is started from 1.4020, 1.4000, 1.3980.
The British pound remains in the restrained-uptrend, demonstrating a slowdown in growth.
USD CHF (current price: 0.9630)

- Support levels: 0.9250 (August 2015 minimum), 0.9150, 0.9050 (May 2015 minimum).
- Resistance levels:, 0.9550, 0.9800, 1.0030 (November 2017 maximum).
- Computer analysis: MACD (12,26,9) (signal – upward movement): the indicator is above 0, the signal line is in the body of the histogram. RSI (14) is in the overbought zone. IchimokuKinkoHyo (9,26,52) (signal- upward movement): the Tenkan-sen line is above the Kijun-sen line, the price is higher than the cloud.
- The main recommendation: sale entry is started from 0.9650, 0.9670, 0.9690.
- Alternative recommendation: buy entry is started from 0.9600, 0.9580, 0.9550.
The Swiss franc continues to trade with a decrease in the growth of the American.
USD JPY (current price: 106.10)

- Support levels: 105.50, 104.50, 103.40.
- Levels of resistance: 107.00, 108.00, 108.60.
- Computer analysis: MACD (12, 26, 9) (signal – upward movement): the indicator is above 0, the signal line is in the body of the histogram. RSI (14) is in the overbought zone. IchimokuKinkoHyo (9,26,52) (signal-upward movement): the Tenkan-sen line is above the Kijun-sen line, the price is higher than the cloud.
- The main recommendation: sale entry is started from 107.20, 107.40, 107.60.
- Alternative recommendation: buy entry is started from 106.80, 106.50, 105.20.
The pair accelerated growth on risk mitigation, but it is traded near significant resistance, limiting itself to overbought.
USD CAD (current price: 1.2770)
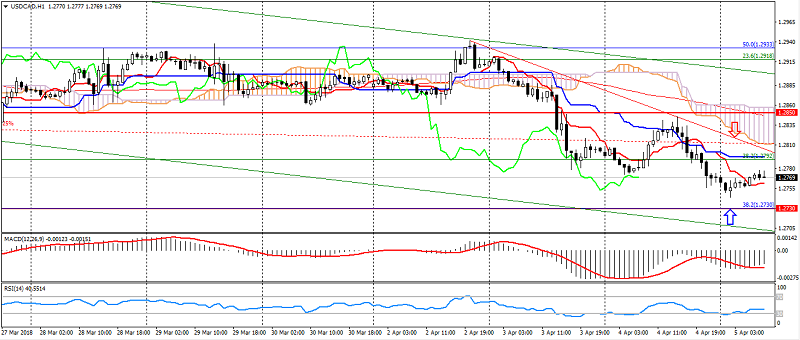
- Support levels: 1.2950, 1.2730.1.2600.
- Resistance levels: 1.3030, 1.3150, 1.3280.
- Computer analysis: MACD (12, 26, 9) (signal – upward movement): the indicator is below 0, the signal line has left the body of the histogram. RSI (14) is in the neutral zone. IchimokuKinkoHyo (9,26,52) (signal – downward movement): the Tenkan-sen line is below the Kijun-sen line, the price is below the cloud.
- The main recommendation: sale entry is started from 1.2800, 1.2830, 1.2850.
- Alternative recommendation: buy entry is started from 1.2750, 1.2720, 1.2700.
The pair is traded lower, despite a bullish divergence.
AUD USD (current price: 0.7690)

- Support levels: 0.7900, 0.7700 (March 2017 maximum), 0.7500.
- Resistance levels: 0.8120 (2017 maximum), 0.8200, 0.8290 (2014 maximum).
- Computer analysis: MACD (12, 26, 9) (signal – downward movement): the indicator is above 0, the signal line has left the body of the histogram. RSI (14) is in the neutral zone. IchimokuKinkoHyo (9,26,52) (signal – upward movement, flat): the Tenkan-sen line is above the Kijun-sen line, the price is in the cloud.
- The main recommendation: sale entry is started from 0.7670, 0.7750, 0.7730.
- Alternative recommendation: buy entry is started from 0.7700, 0.7730, 0.7750.
The Australian went into the correction phase, but maintains an upward trend.
NZD USD (current price: 0.7290)
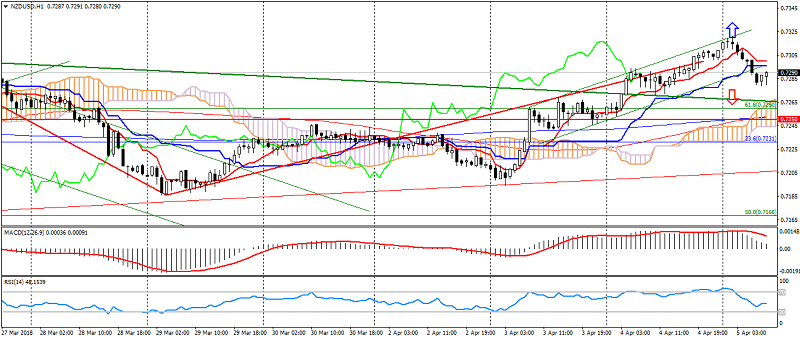
- Support levels: 0.7250, 0.7130 (August 2017 minimum), 0.7000.
- Resistance levels: 0.7380, 0.7450, 0.7550 (2017 maximum).
- Computer analysis: MACD (12, 26, 9) (signal- downward movement): the indicator is above 0, the signal line has left the body of the histogram. RSI (14) is in the neutral zone. IchimokuKinkoHyo (9,26,52) (signal-upward movement): the Tenkan-sen line is above the Kijun-sen line, the price is higher than the cloud.
- The main recommendation: sale entry is started from 0.7300, 0.7320, 0.7340.
- Alternative recommendation: buy entry is started from 0.7270, 0.7250, 0.7130.
The New Zealand dollar continues to move in an uptrend, but is limited to the level of 0.7300.
XAU USD (current price: 1326.00)
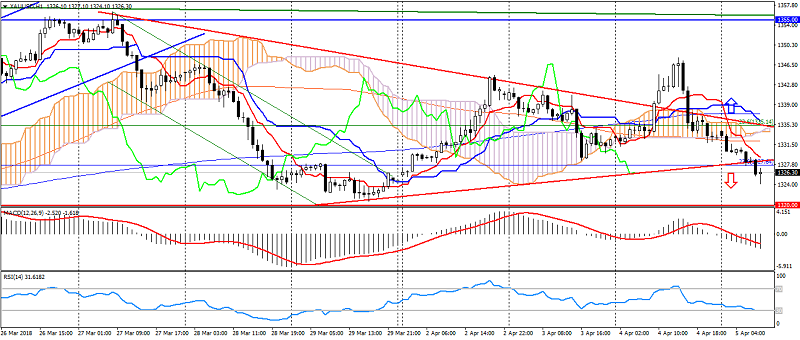
- Support levels: 1320.00, 1303.00, 1280.00.
- Resistance levels: 1355.00 (May May 2016 maximum), 1374.00, 1290.00 (March 2016 maximum).
- Computer analysis: MACD (12, 26, 9) (signal – downward movement): the indicator is below 0, the signal line is in the body of the histogram. RSI (14) is in the oversold zone. IchimokuKinkoHyo (9,26,52) (signal- upward movement): the Tenkan-sen line is below the Kijun-sen line, the price is below the cloud.
- The main recommendation: sale entry is started from 1332.00, 1335.00, 1340.00.
- Alternative recommendation: buy entry is started from 1323.00, 1320.00, 1317.00.
Gold returned to the lateral triangle on risk reduction.