
Тechnical analysis of currency pairs (Anton Hanzenko)
EUR USD (current price: 1.1890)
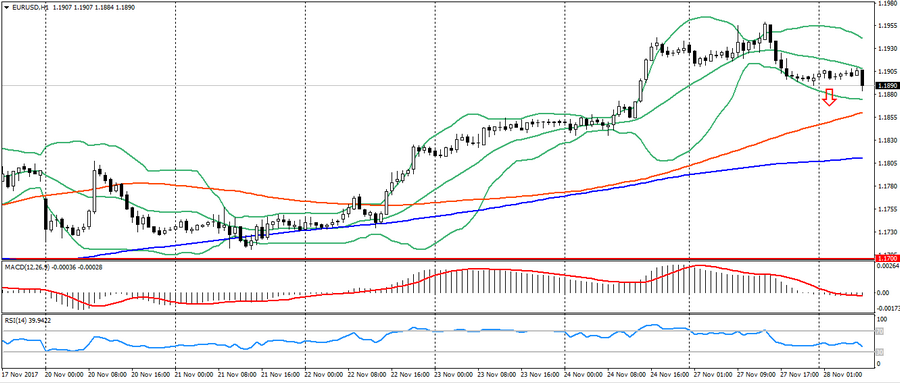
- Support levels: 1.1700 (August 2015 maximum), 1.1600 (2016 maximum), 1.1470.
- Levels of resistance: 1.2000, 1.2100, 1.2270 (November 2014 minimum).
- Computer analysis: MACD (signal – downward motion): the indicator is below 0, the signal line is in the body of the histogram. RSI is in the neutral zone. Bollinger Bands (period 20): neutral, declining volatility.
- The main recommendation: sale entry is started from 1.1940, 1.1960, 1.1980.
- Alternative recommendation: buy entry is started from 1.1880, 1.1850 (MA 100), 1.1800 (MA 200).
The euro was under pressure after restrained trading in the Asian session. The correction was caused by a significant overbought of the single currency and positive data on real estate in the US, which came out yesterday.
GBP USD (current price: 1.3320)
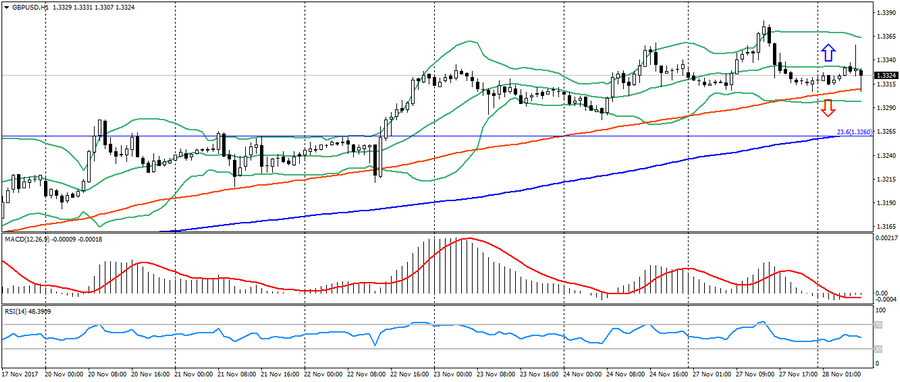
- Support levels: 1.3140, 1.2900, 1.2740 (the minimum of August 2017).
- Resistance levels: 1.3500, 1.3660, 1.3830 (February 2016 minimum).
- Computer Analysis: MACD (the signal – a downward motion): the indicator is below 0, the signal line is in the body gistogrammy.RSI is in the neutral zone. Bollinger Bands (period 20): neutral, low volatility.
- The main recommendation: sale entry is started from 1.3360, 1.3380, 1.3400.
- Alternative recommendations: buy entry is started from 1.3300 (MA 100), 1.3260 (23.6 fibo of January’s low.), 1.3140.
The British pound demonstrates multidirectional dynamics at the beginning of the day due to the slowing of the uptrend and the formation of the figure “head and shoulders”.
USD CHF (current price: 0.9820)
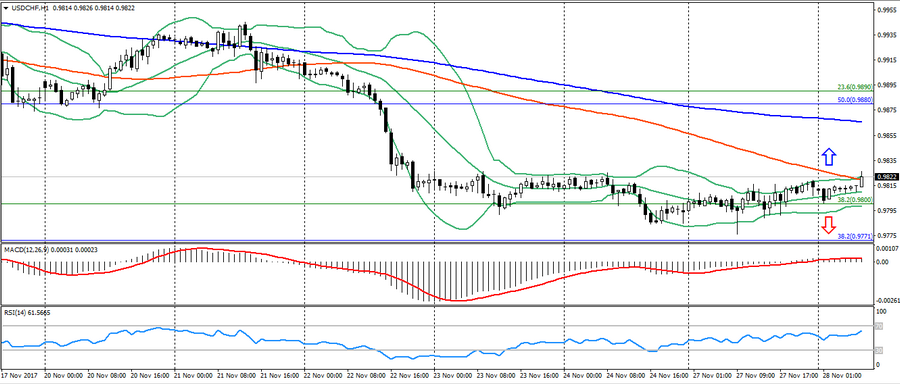
- Support levels: 0.9700, 0.9600, 0.9530.
- Resistance levels: 1.0000, 1.0050, 1.0100 (May maximum).
- Computer analysis: MACD (signal – upward motion): the indicator is above 0, the signal line is in the body of the histogram. RSI is in the neutral zone. Bollinger Bands (period 20): neutral, low volatility.
- The main recommendation: sale entry is started from 0.9830, 0.9860 (MA 200), 0.9880 (Fibo., 50.0 of the maximum in November 2016.).
- Alternative recommendation: buy entry is started from 0.9800, 0.9770 (Fibo., 38.2 from November 2016 high), 0.9740.
The Swiss franc has found a significant resistance at the level 0.9800, from which the formation of correction is traced.
USD JPY (current price: 111.20)
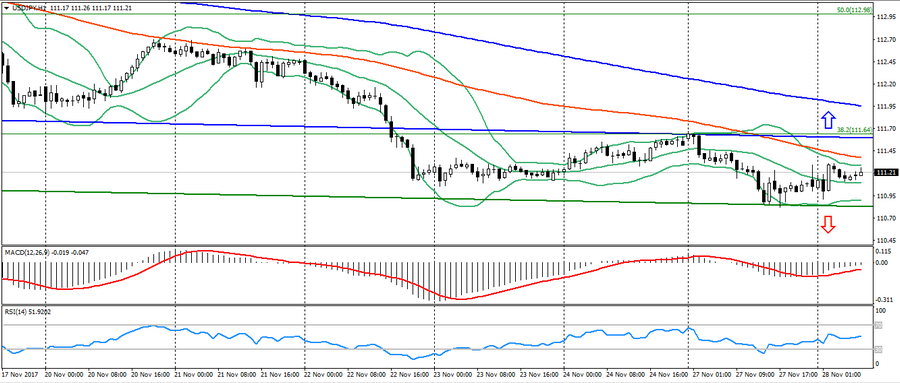
- Support levels: 108.90, 108.10 (April 2017 minimum), 107.30 (2017 minimum).
- Resistance levels: 113.70, 114.50 (July 2017 maximum), 115.00.
- Computer analysis: MACD (signal – upward motion): the indicator is below 0, the signal line has left the body of the histogram. RSI is in the neutral zone. Bollinger Bands (period 20): neutral, low volatility.
- The main recommendation: sale entry is started from 111.40, 111.60 (Fibo. 38.2 from the maximum of December), 111.90 (MA 200).
- Alternative recommendation: buy entry is started from 110.90, 110.70, 110.50.
The Japanese yen remains in the zone of uncertainty, which is caused by fears of new stimulus measures from the Bank of Japan.
USD CAD (current price: 1.2760)
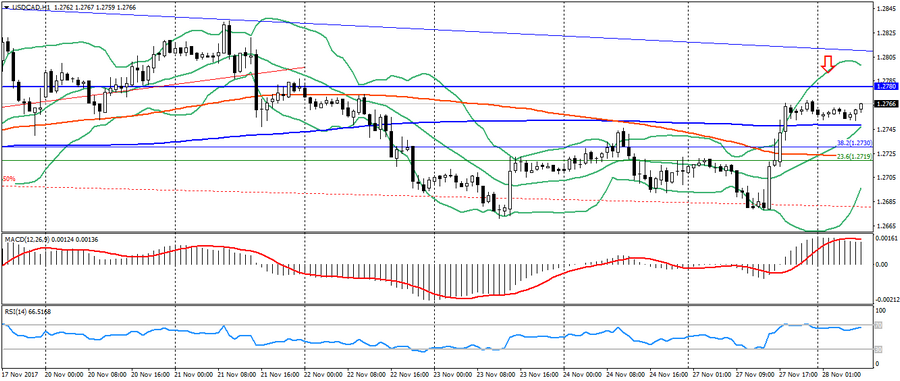
- Support levels: 1.2200, 1.2060 (2017 minimum), 1.1950 (2015 minimum).
- Resistance levels: 1.2780 (August 2017 maximum), 1.3000, 1.3160.
- Computer Analysis: MACD (the signal – a downward motion): the indicator is above 0, the signal line is out of the histogram.RSI is in the overbought zone. Bollinger Bands (period 20): neutral, declining volatility.
- The main recommendation: sale entry is started from 1.2780, 1.2800, 1.2830.
- Alternative recommendation: buy entry is started from 1.2740, 1.2730 (Fibo, 38.2 from the May maximum), 1.2680.
The Canadian dollar remains under pressure of negative dynamics of raw materials, but continues to be limited by a downward trend in this pair.
AUD USD (current price: 0.7600)
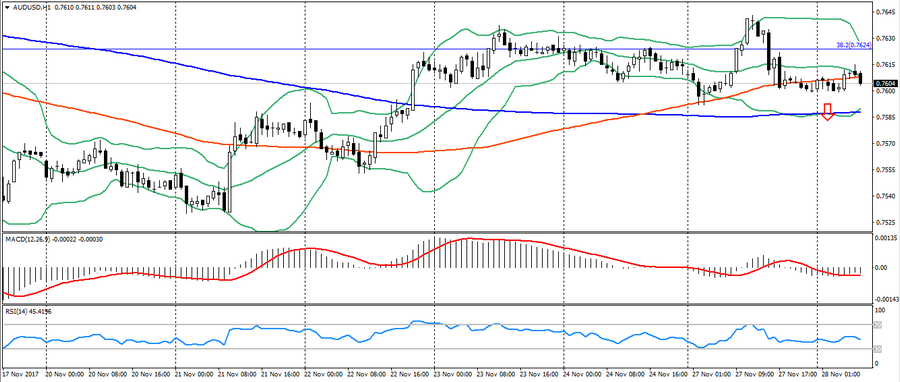
- Support levels: 0.7740, 0.7320 (2017 minimum), 0.7120.
- Resistance levels: 0.8120 (2017 maximum), 0.8200, 0.8290 (2014 maximum).
- Computer analysis: MACD (signal – downward motion): the indicator is below 0, the signal line is in the body of the histogram. RSI is in the neutral zone. Bollinger Bands (period 20): neutral, declining volatility.
- The main recommendation: sale entry is started from 0.7630 (Fibo, 38.2 from the low of January 2016), 0.7650, 0.7670.
- Alternative recommendation: buy entry is started from 0.7600, 0.7580 (MA 200), 0.7560.
The Australian continues to be limited to the resistance level 0.7630, the withdrawal from which will indicate the resumption of the downtrend.
NZD USD (current price: 0.6930)
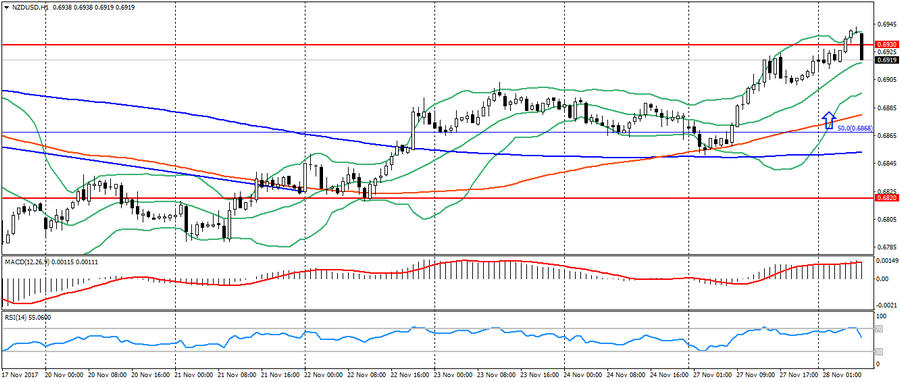
- Support levels: 0.7000, 0.6930, 0.6820 (the minimum of the current year).
- Resistance levels: 0.7380, 0.7450, 0.7550 (2017 maximum).
- Computer analysis: MACD (signal – upward motion): the indicator is above 0, the signal line is in the body of the histogram. RSI is in the neutral zone. Bollinger Bands (period 20): neutral, growing volatility.
- The main recommendation: sale entry is strted from 0.6950, 0.6970, 0.7000.
- Alternative recommendation: buy entry is started from 0.6930, 0.6900, 0.6880.
The New Zealand dollar remains in the correction phase on the rebound from significant support 0.6800-20.
XAU USD (current price: 1292.00)
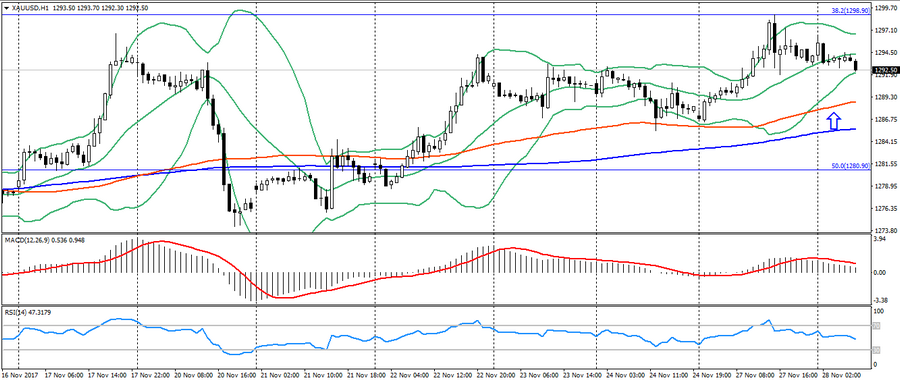
- Support levels: 1250.00, 1226.00, 1200.00.
- Resistance levels: 1340.00, 1355.00, 1374.00 (2016 maximum).
- Computer analysis: MACD (signal – downward motion): the indicator is higher than 0, the signal line has left the body of the histogram. RSI is in the neutral zone. Bollinger Bands (period 20): neutral, declining volatility.
- The main recommendation: sale entry is started from 1299.00 (Fibo 38.2 from the July’s low), 1303.00, 1305.00.
- Alternative recommendation: buy entry is started from 1289.00 (MA 100), 1285.00 (MA 200), 1281.00 (Fibo. 50.0 from the July low).
Gold has weakened slightly due to the correction after growth, but it maintains an upward trend.