
Technical analysis of currency pairs (Anton Hanzenko)
EUR USD (current price: 1.1760)
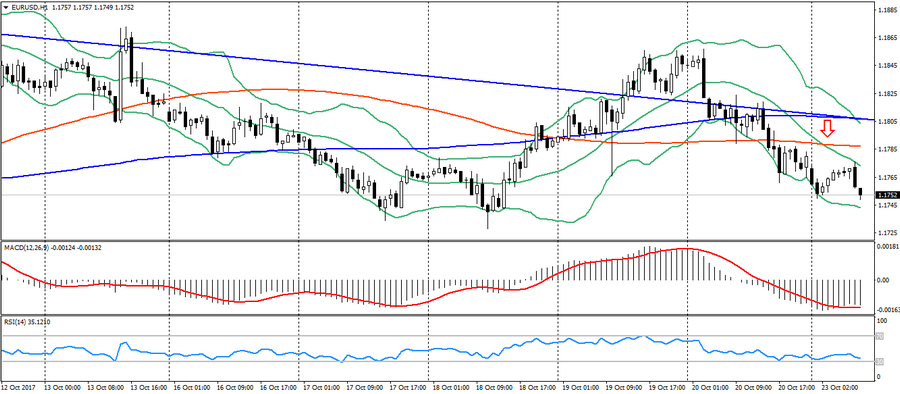
- Support levels: 1.1700 (maximum of August 2015), 1.1600 (maximum of 2016), 1.1470.
- Levels of resistance: 1.2000, 1.2100, 1.2270 (minimum of November 2014).
- Computer analysis: MACD (signal – upward motion): the indicator is below 0, the signal line has left the body of the histogram. RSI is in the neutral zone. Bollinger Bands (period 20): neutral, declining volatility.
- The main recommendation: sale entry is from 1.1790 (MA 100), 1.1810 (MA 200), 1.1860.
- Alternative recommendation: buy entry is from 1.1740, 1.1700, 1.1680 (Fibo. 23.6 from the low of December last year).
The euro remains trading under pressure, maintaining a downward trend on the overall strengthening of the American. Confirming a downtrend on the pair, which so far is limited to support at last week’s lows.
GBP USD (current price: 1.3180)
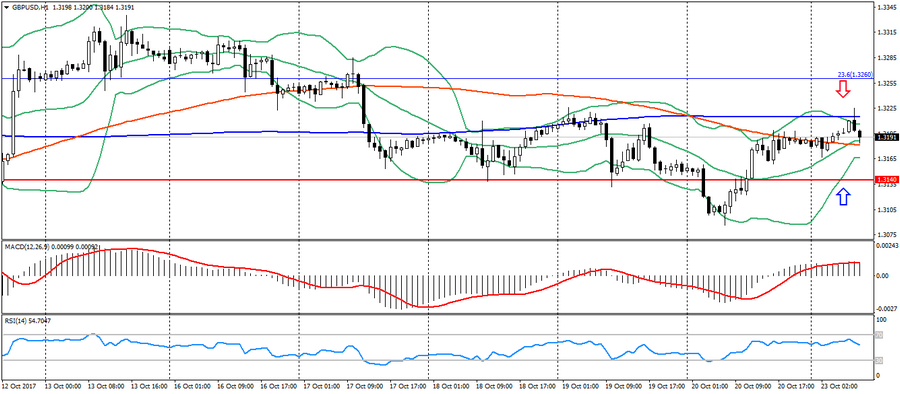
- Support levels: 1.3140, 1.2900, 1.2740 (minimum of August 2017).
- Resistance levels: 1.3500, 1.3660, 1.3830 (minimum of February 2016).
- Computer analysis: MACD (signal – upward motion): indicator above 0, signal line in the body of the histogram. RSI is in the neutral zone. Bollinger Bands (period 20): neutral, low volatility.
- The main recommendation: sale entry is from 1.3220 (MA 200), 1.3260 (Fibo. 23.6 from January of the current year), 1.3290.
- Alternative recommendation: buy entry is from 1.3170, 1.3140, 1.3100.
The British pound also remains trading at the level of the opening of the day, trading in some uncertainty, keeping the movement in a sideways trend.
USD CHF (current price: 0.9840)
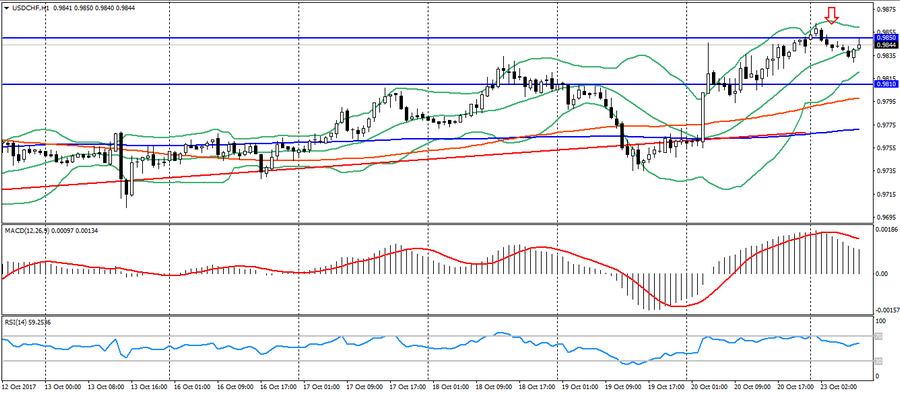
- Support levels: 0.9600, 0.9530, 0.9440 (minimum of July 2017).
- Resistance levels: 0.9810, 0.9850, 0.9900.
- Computer analysis: MACD (signal – downward motion): the indicator is higher than 0, the signal line has left the body of the histogram. RSI is in the neutral zone. Bollinger Bands (period 20): neutral, low volatility.
- The main recommendation: sale entry is from 0.9850, 0.9870, 0.9900.
- Alternative recommendation: buy entry is from 0.9810, 0.9790 (MA 100), 0.9770 (MA 200).
The Swiss franc is trading downward, remaining under pressure of the American, but is also limited to a noticeable overbought.
USD JPY (current price: 113.80)
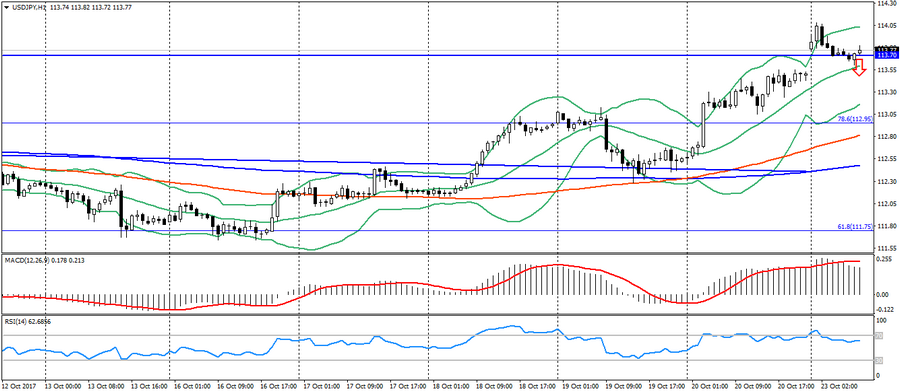
- Support levels: 108.90, 108.10 (minimum of April 2017), 107.30 (minimum of 2017).
- Resistance levels: 113.70, 114.50 (maximum of July 2017), 115.00.
- Computer analysis: MACD (signal – downward motion): the indicator is higher than 0, the signal line has left the body of the histogram. RSI is in the overbought zone. Bollinger Bands (period 20): neutral, growing volatility.
- The main recommendation: sale entry is from 114.00 (maximum of the month), 114.30, 114.50.
- Alternative recommendation: buy entry is from 113.50, 113.20, 112.90 (Fibo 78.6 from the maximum of July).
The Japanese yen remains trading at the opening of the day after a decline in the results of the parliamentary elections in Japan. The opening of the week with a small gap indicates the possibility of reducing the pair and closing the gap, but the downward dynamics will be limited to the correction of the uptrend.
USD CAD (current price: 1.2630)
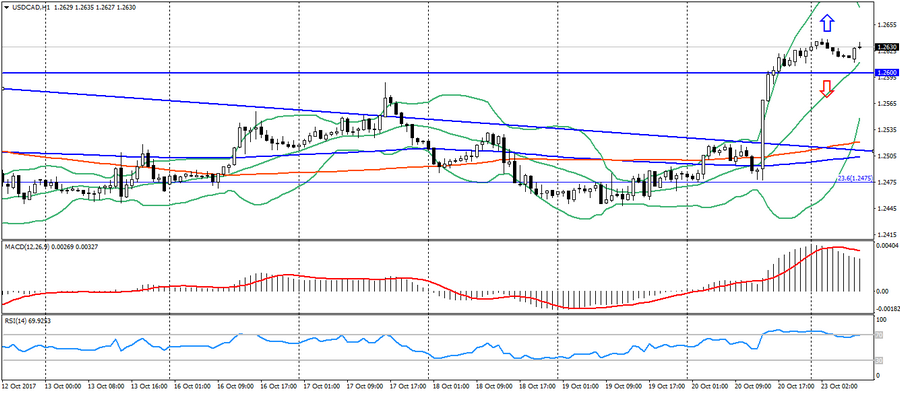
- Support levels: 1.2200, 1.2060 (minimum of 2017), 1.1950 (minimum of 2015).
- Resistance levels: 1.2780 (maximum of August 2017), 1.3000, 1.3160.
- Computer analysis: MACD (signal – downward motion): the indicator is higher than 0, the signal line has left the body of the histogram. RSI is in the overbought zone. Bollinger Bands (period 20): neutral, declining volatility.
- The main recommendation: sale entry is from 1.2640, 1.2680 (MA 100 to D1), 1.2730 (Fibo, 38.2 from the May’s high).
- Alternative recommendation: buy entry from 1.2600, 1.2570, 1.2530.
The Canadian dollar is trading in a sideways trend after a significant Friday’s decline. Despite the significant overbought, the pair remains in a state of uncertainty, trading in a sideways trend.
AUD USD (current price: 0.7820)
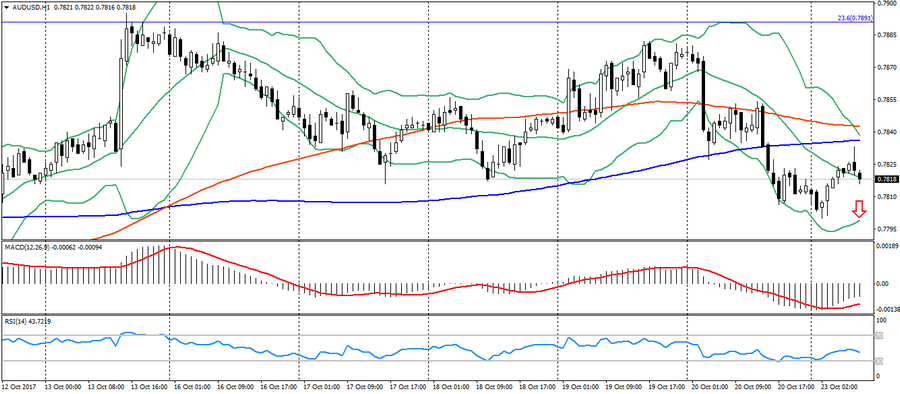
- Support levels: 0.7740, 0.7320 (minimum of 2017), 0.7120.
- Resistance levels: 0.8120 (maximum of 2017), 0.8200, 0.8290 (maximum of 2014).
- Computer analysis: MACD (signal – upward motion): the indicator is below 0, the signal line has left the body of the histogram. RSI is in the neutral zone. Bollinger Bands (period 20): neutral, declining volatility.
- The main recommendation: sale entry is from 0.7840 (MA 100), 0.7860, 0.7880.
- Alternative recommendation: buy entry is from 0.7800, 0.7780, 0.7760.
The Australian dollar, despite the increase at the beginning of the day, continues to trade in a downtrend, indicating the possibility of further decline.
NZD USD (current price: 0.6970)

- Support levels: 0.7000, 0.6930, 0.6820 (minimum of the current year).
- Resistance levels: 0.7380, 0.7450, 0.7550 (maximum of 2017).
- Computer analysis: MACD (signal – upward motion): the indicator is below 0, the signal line has left the body of the histogram. RSI is in the neutral zone. Bollinger Bands (period 20): neutral, growing volatility.
- The main recommendation: sale entry is from 0.6980 (Fibo, 78.6 from the May low), 0.7000, 0.7030.
- Alternative recommendation: buy entry is from 0.6930, 0.6900, 0.6870.
The New Zealand dollar remains under pressure of political risks in New Zealand, groping for support at 0.6980 (Fibo 78.6 from the May low). But, along with this, it retains the potential to decline.
XAU USD (current price: 1275.00)
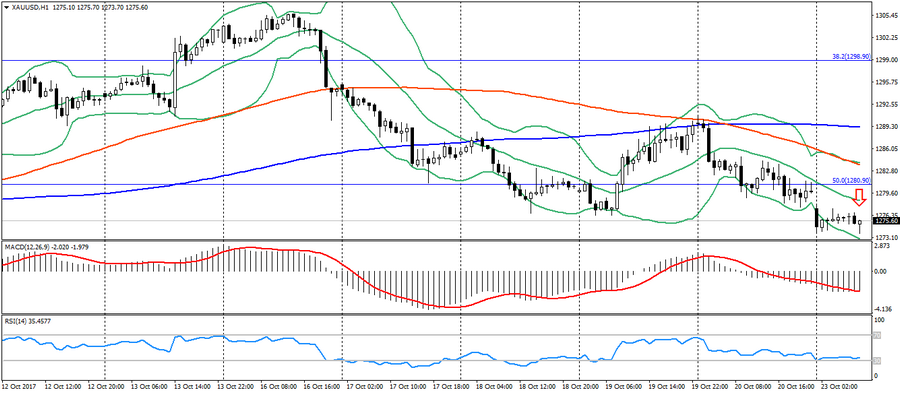
- Support levels: 1250.00, 1226.00, 1200.00.
- Resistance levels: 1340.00, 1355.00, 1374.00 (maximum of 2016).
- Computer analysis: MACD (signal – downward motion): the indicator is below 0, the signal line in the body of the histogram. RSI is in the oversold zone. Bollinger Bands (period 20): neutral, growing volatility.
- The main recommendation: sale entry is from 1281.00 (Fibo, 50.0 from the July’s low), 1285.00 (MA 100), 1289.00 (MA 200).
- Alternative recommendation: buy entry is from 1274.00, 1270.00, 1267.00.
Gold remains under pressure of correction of the American, pointing to the possibility of further decline.