
Technical analysis of currency pairs (Anton Ganzenko)
EUR USD (current price: 1.1790)
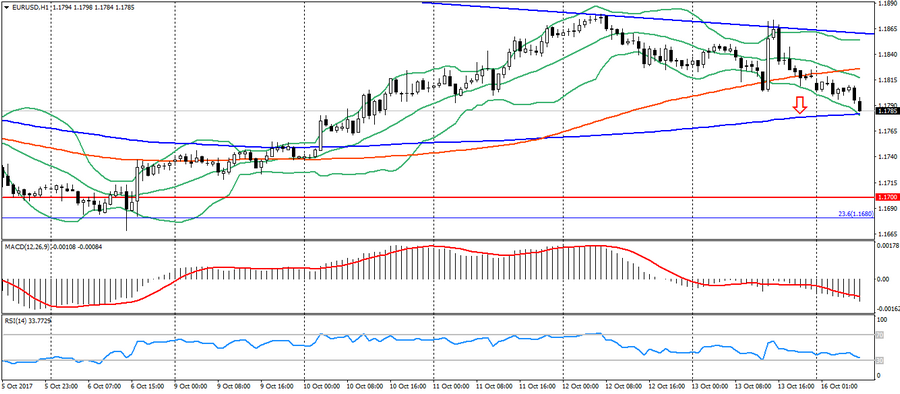
- Support levels: 1.1700 ( the maximum of August 2015), 1.1600 ( the maximum of 2016), 1.1470.
- Levels of resistance: 1.2000, 1.2100, 1.2270 ( the minimum of November 2014).
- Computer analysis: MACD (signal – downward motion): the indicator is below 0, the signal line in the body of the histogram. RSI in the oversold zone. Bollinger Bands (period 20): neutral, growing volatility.
- The main recommendation: entry for sale from 1.1810, 1.1850, 1.1880 (last week’s high).
- Alternative recommendation: buy entry is from 1.1780 (MA 200), 1.1750, 1.1720.
The euro remains to trade with a decrease at the beginning of the week on the resumption of negative sentiments in Catalonia and the correction of the American. The dynamics of the pair remains to be limited to the existing downward trend. For today, the news on the eurozone and the US is expected.
GBP USD (current price: 1.3280)
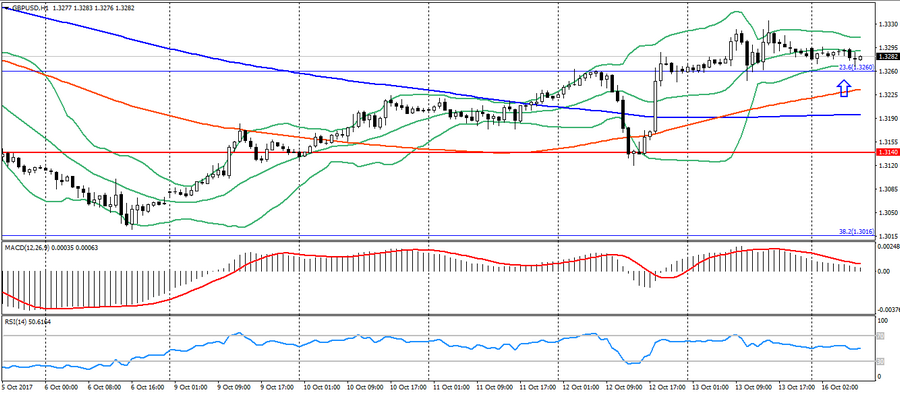
- Support levels: 1.3140, 1.2900, 1.2740 (the minimum of August 2017).
- Resistance levels: 1.3500, 1.3660, 1.3830 (the minimum of February 2016).
- Computer analysis: MACD (signal – downward motion): the indicator is higher than 0, the signal line has left the body of the histogram. RSI in the neutral zone. Bollinger Bands (period 20): neutral, low volatility.
- The main recommendation: sale entry is from 1.3330, 1.3350, 1.3410.
- Alternative recommendation: buy entry is from 1.3230 (MA 100), 1.3190 (MA 200), 1.3140.
The British pound remains to trade at the opening level of the week. The pair continues to maintain growth. Fastening above the level of 1.3260 (FIBO. 23.2 from the low of the current year) will open the way to further growth. For today, the news on the eurozone and the US is expected.
USD CHF (current price: 0.9760)
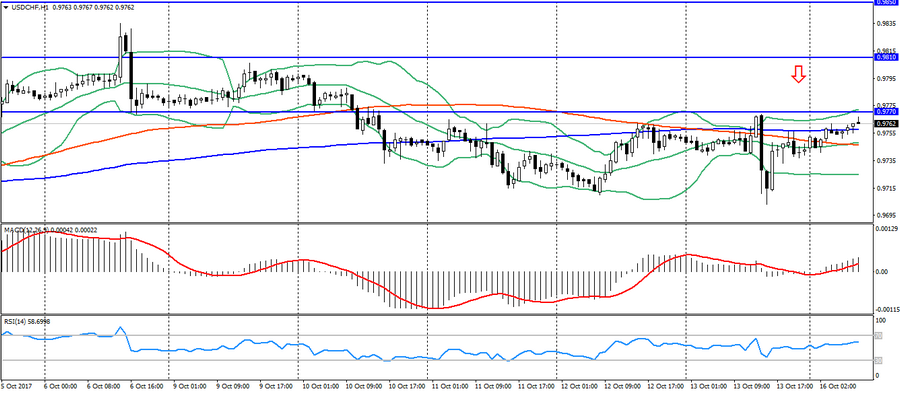
- Support levels: 0.9530, 0.9440 (the minimum of July 2017), 0.9420 (the minimum of September 2017).
- Resistance levels: 0.9770 (the maximum of August 2017), 0.9810, 0.9850.
- Computer analysis: MACD (signal – upward motion): indicator above 0, signal line in the body of the histogram. RSI in the neutral zone. Bollinger Bands (period 20): neutral, growing volatility.
- The main recommendation: sale entry is from 0.9770, 0.9800, 0.9830 (maximum of the last two months).
- Alternative recommendation: buy entry is from 0.9700, 0.9660 (MA 200), 0.9600.
The Swiss franc remains under pressure at the beginning of the day on the negative dynamics of the euro. Frank remains under American pressure, but is limited to significant levels of resistance. For today, the news on the eurozone and the US is expected.
USD JPY (current price: 111.70)
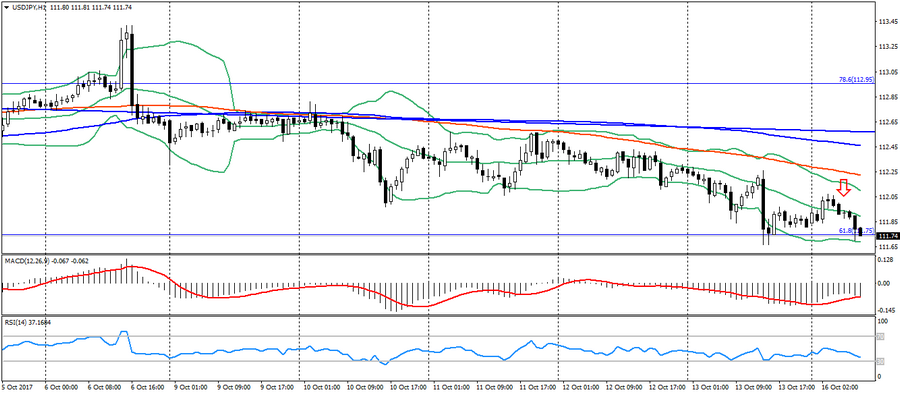
- Support levels: 108.90, 108.10 (the minimum of April 2017), 107.30 (the minimum of 2017).
- Resistance levels: 113.70, 114.50 (the maximum of July 2017), 115.00.
- Computer analysis: MACD (signal – downward motion): the indicator is below 0, the signal line in the body of the histogram. RSI in the light oversold zone. Bollinger Bands (period 20): neutral, low volatility.
- The main recommendation: sale entry is from 112.00, 112.20 (MA 100), 112.50 (MA 200).
- Alternative recommendation: buy entry is from 111.70 (FIBO 61.8 from the July’s maximum), 111.50, 111.30 (MA 200 per H4).
The Japanese yen remains to trade with strengthening on the possibility of aggravation of the situation on the Korean Peninsula. For today, the news on the US is expected.
USD CAD (current price: 1.2470)
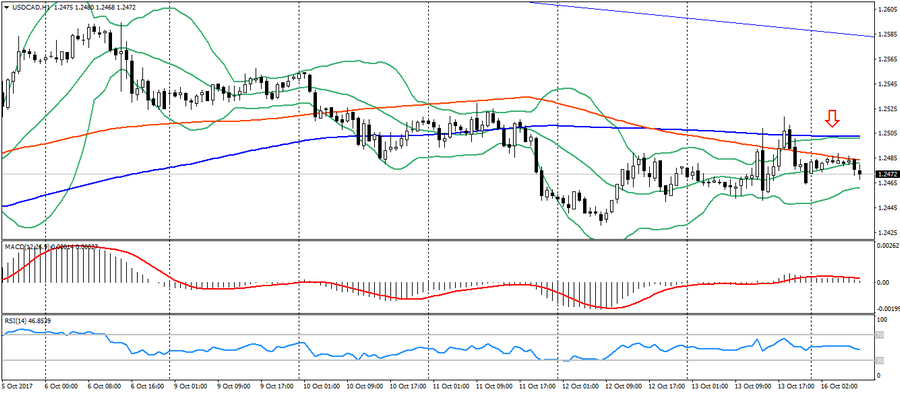
- Support levels: 1.2200, 1.2060 (the minimum of 2017), 1.1950 (the minimum of 2015).
- Resistance levels: 1.2780 (the maximum of August 2017), 1.3000, 1.3160.
- Computer analysis: MACD (signal-flat): indicator near 0. RSI in the neutral zone. Bollinger Bands (period 20): neutral, growing volatility.
- The main recommendation: sale entry is from 1.2500 (MA 200), 1.2530, 1.2550.
- Alternative recommendation: buy entry is from 1.2460, 1.2430, 1.2380 (MA 200).
The Canadian dollar remains to trade with a slight strengthening on the positive dynamics of raw materials. In addition, the Canadian maintains an upward trend, which in the end can cause a decline in this pair. For today, the news on the USA and Canada is expected.
AUD USD (current price: 0.7870)
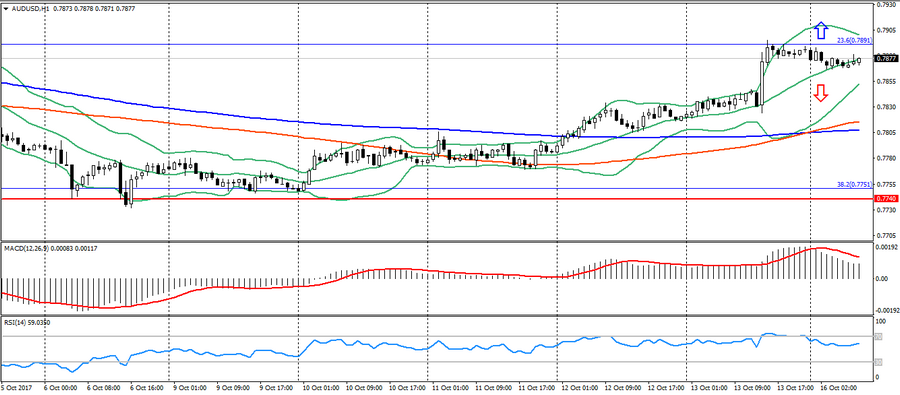
- Support levels: 0.7740, 0.7320 (the minimum of 2017), 0.7120.
- Resistance levels: 0.8120 (the maximum of 2017), 0.8200, 0.8290 (the maximum of 2014).
- Computer analysis: MACD (signal – downward motion): the indicator is higher than 0, the signal line has left the body of the histogram. RSI in the neutral zone. Bollinger Bands (period 20): neutral, declining volatility.
- The main recommendation: sale entry is from 0.7890 (FIBO, 23.6 the minimum of December last year), 0.7920, 0.7950.
- Alternative recommendation: buy entry is from 0.7840 (MA 100), 0.7790, 0.7740.
The Australian dollar remains to trade in a short-term uptrend, but is limited to the level of 0.7890-0.8000 (FIBO. 23.6 from the minimum of November last year), which may cause a trend reversal. For today, the news on the USA is expected.
NZD USD (current price: 0.7170)
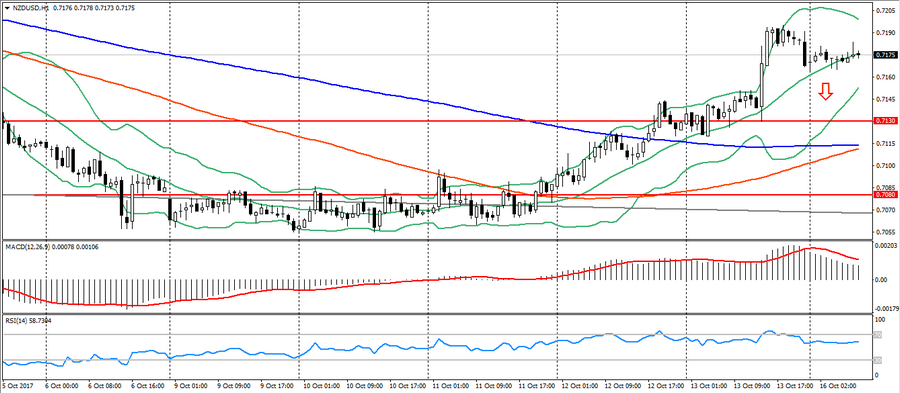
- Support levels: 0.7130 (the minimum of August 2017), 0.7080, 0.7000.
- Resistance levels: 0.7450, 0.7550 (the maximum of 2017), 0.7690.
- Computer analysis: MACD (signal – downward motion): the indicator is higher than 0, the signal line has left the body of the histogram. RSI in the neutral zone. Bollinger Bands (period 20): neutral, declining volatility.
- The main recommendation: sale entry is from 0.7210, 0.7240, 0.7260 (MA 100 to D1).
- Alternative recommendation: buy entry is from 0.7160, 0.7130, 0.7110 (MA 200).
The New Zealand dollar is trading at the opening day level indicating a slowdown of the uptrend. For today, the news on the USA is expected.
XAU USD (current price: 1304.00)
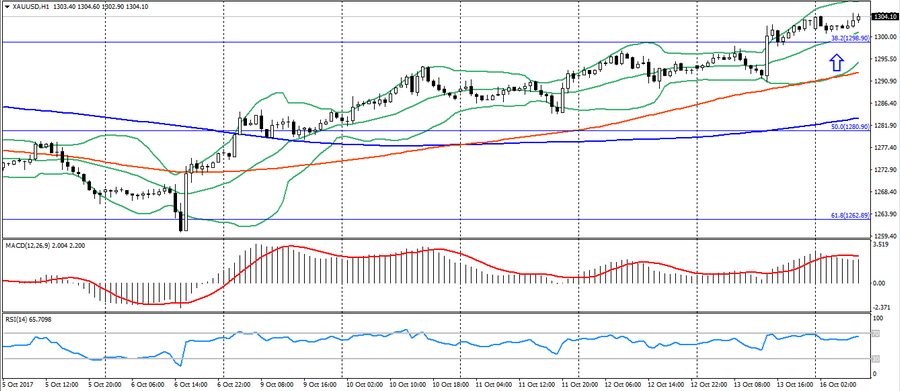
- Support levels: 1250.00, 1226.00, 1200.00.
- Resistance levels: 1340.00, 1355.00, 1374.00 (the maximum of 2016).
- Computer analysis: MACD (signal – downward motion): the indicator is higher than 0, the signal line has left the body of the histogram. RSI in the overbought zone. Bollinger Bands (period 20): neutral, declining volatility.
- The main recommendation: sale entry is from 1305.00 (MA 200 to H4), 1311.00 (maximum of three weeks), 1317.00.
- Alternative recommendation: buy entry is from 1292.00 (MA 100), 1283.00 (MA 200), 1278.00.
Gold remains in the upward weekly trend.