
Price chart on financial markets. Three types. The benefits of each. Alexander Sivtsov.
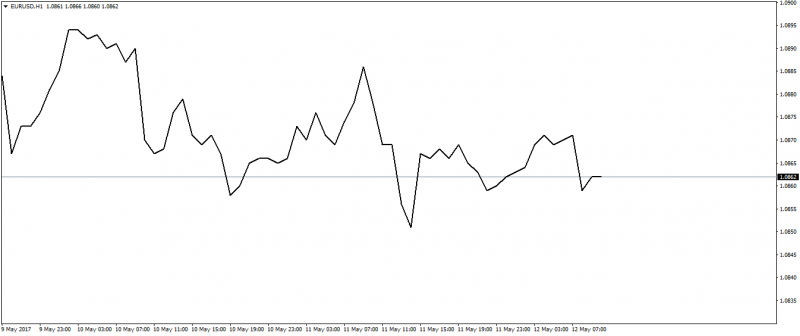
The basis of trading in financial markets is the study and analysis of price movements using a chart. The chart is formed based on the change in the price of the instrument at a particular time interval.
Line chart
The first and simplest form is line chart. Line chart is points that are marked at specific time intervals and are connected by a line. Line chart is the simplest, which in turn affects the information content. However, traders prefer to use it in trading precisely because of the simplicity of the line chart.
The line chart is without visual noise, and also allows you to identify quickly reversal patterns and maximum or minimum price values.
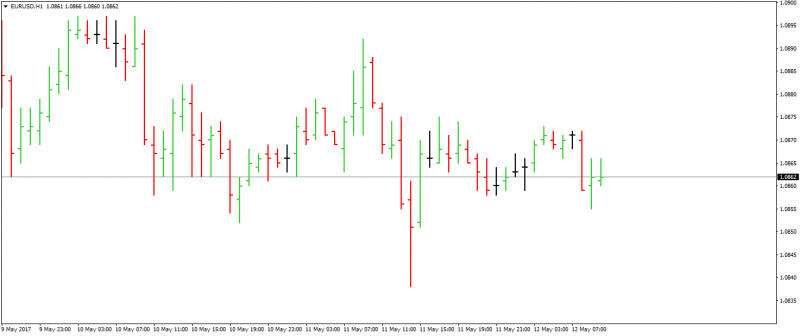
Bar chart
The bar is a vertical line, which represents the price change at a certain time interval, and also displays the opening and closing prices of the bar.
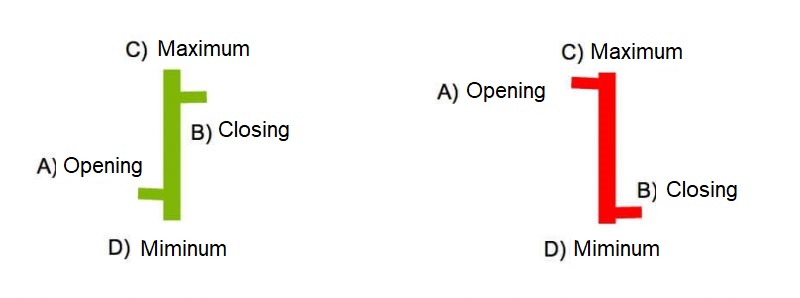
This type of chart is more informative than line and gives more detailed information about the price movement of the instrument. Also, unlike the line chart, the bars chart allows you to see a gap in the chart, which is important in trading, because there are trading systems for earning on gaps.
The drawback of the bars is visualization, which is not very pleasant to the eye and causes some discomfort for most traders when analyzing.
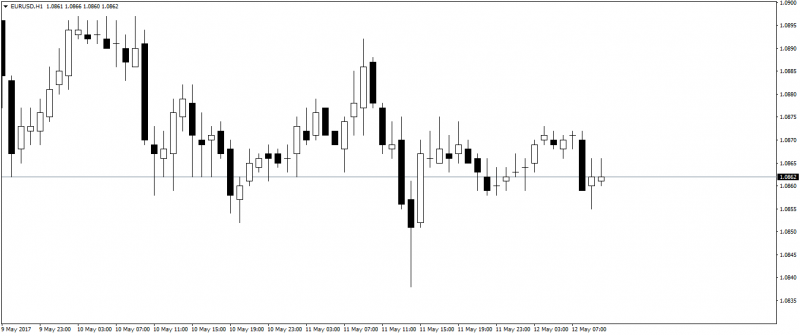
Candlestick chart
Candlesticks – a widely used and most informative type of chart when working on the stock exchange. The body of a Japanese candlestick is formed between the opening and closing prices at a certain time interval, displaying shadows that allow you to see the maximum and minimum price for a certain period of time.
In addition to clearly specifying the opening and closing prices, Japanese candlesticks as well as bars have a different color: the growth candlestick is presented in white and the decline candlestick in black, that simplifies the process of analyzing the market.
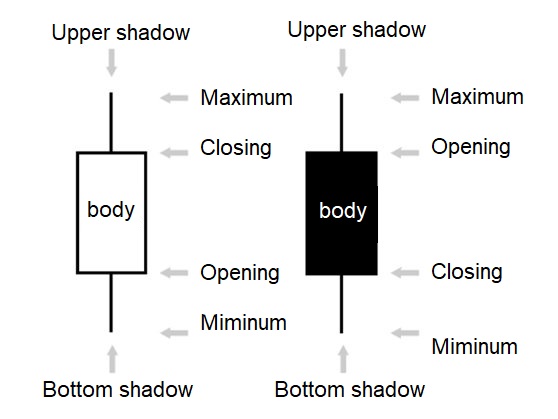
The advantage of Japanese candlestick is their graphics and aesthetics. While the line chart shows the general dynamics of the market, without any details, and the bars are a set of unpleasant crosses, the candlestick shows full information about the price movement over a time interval in a convenient and aesthetic form.
Despite the fact that most traders use Japanese candlestick to analyze the market, the choice will be yours. It is worth using the type of chart which which is more comfortableto work within the framework of the chosen trading strategy.
Follow the Trader’s Blog – know more!
Alexander Sivtsov