
U.S. data
- Core producer price index (PPI) (m/m) (oct), fact 0.3%, forecast 0.2%.
- Initial jobless claims, fact 225K, forecast 215K.
- Producer Price Index (PPI) (m/m) (oct), fact 0.4%, forecast 0.3%
U.S. data were mixed. A rise in producer prices indicated a support for the US consumer inflation, especially after a three-month decline. The negative part of the report was the data on initial applications for benefits, which rose to the June highs.
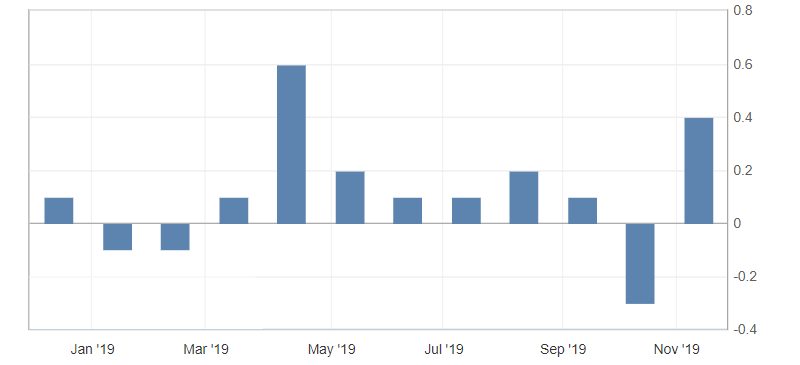
Fig. 1. U.S. Producer Price Index (PPI) chart
The US dollar reacted very restrained to these statistics, continuing to trade in the side channel from 98.50 to 98.20, while maintaining a restrained upward trend, which is limited by the uncertainty about the U.S.-China trade agreement.
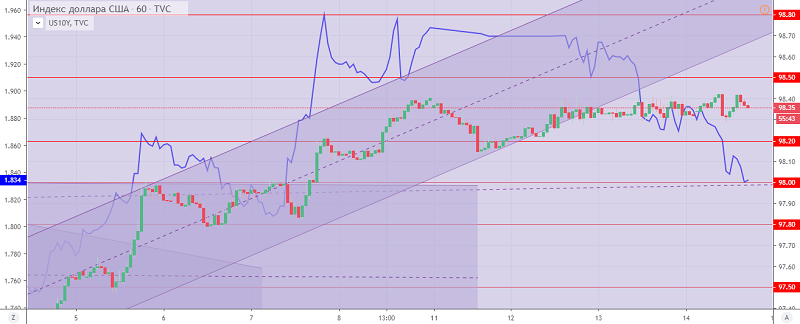
Fig. 2. The US dollar index chart. Current price – 98.40 (10-year US government bonds yield – blue line)
Read also: “Expectations from the July Fed meeting”
Hanzenko Anton
Earn with the help of the trade service on the news Erste News!
Topical articles of the trader’s blog:
- What does the decline in active drilling rigs in the USA indicate?
- The U.S.-China trade agreement news
- The trade war risks are coming back
Current Investment ideas: