
U.S. producer price data
- Core producer price index (PPI) (m/m) (September), fact -0.3%, forecast 0.2%.
- Producer Price Index (PPI) (m/m) (September), fact -0.3%, forecast 0.1%.
The producer price index (PPI) in the United States fell to its lowest level since October 2016, raising concerns about growing consumer inflation to the target level. This serves as a very negative signal in the face of a slowdown in the US economy.
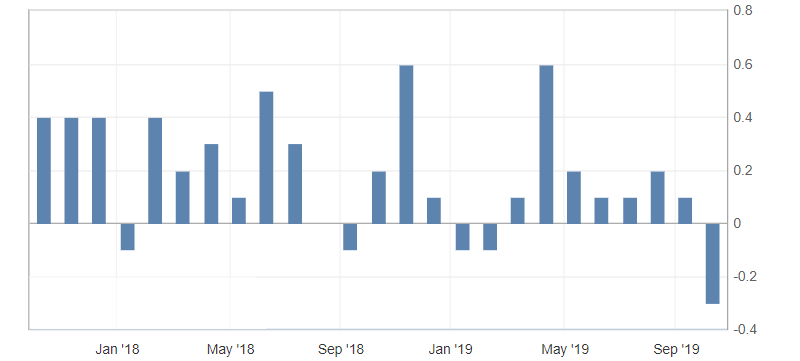
Fig. 1. US Producer Price Index (PPI) Chart
The US dollar index reacted very restrained to the published data, indicating a resumption of decline to support levels of 98.80-60. The dynamics of the American dollar against a basket of competitors remains limited by the side channel from 99.00-10 to 98.70-60.
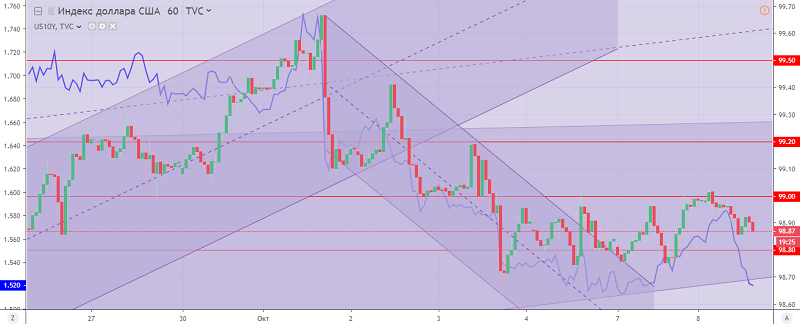
Fig. 2. The US dollar index chart. Current price – 98.90 (10-year US government bonds yield – blue line)
Read also: “A new front opens in the trade war”
Hanzenko Anton
Earn with the help of the trade service on the news Erste News!
Topical articles of the trader’s blog:
- Risks of global economic slowdown are escalating
- What indicators choose Forex traders (Part 2)
- Stock indices are ready to renew a historical high
Current Investment ideas: