Moving Averange as an indicator for determining the strength of a trend. Anton Hanzenko.
It’s no secret that trend trading is much safer and more efficient than against it. Therefore, there is an expression – “The trend is your friend.” And it is difficult to argue with this using trend trading strategies.
But of course not everything is as easy as it should be. Even when trading with a trend, a trader faces many problems, such as: stability and strength of a trend, market noise and short duration, and many others. There is no single simple solution to these problems, but you can determine the strength and direction of the trend using one simple indicator – the moving average (Moving Averange).
To determine the strength and direction of the trend using moving averages (Moving Averange), we need to mark four MAs on the price chart, two of which will be slow MAs with the recommended period parameters of 100 and 200. The remaining Moving Averange parameters remain the default: Shift: 0; MA Method: Simple; Apply to: Close. The other two fast MAs have parameters 20 and 50. MA parameters are taken from personal experience and may vary slightly depending on the market conditions and currency pairs.
The idea of this method is to determine the price in relation to slow moving averages and the very direction of the data of averages. If slow MAs have an upward trend and the price is above them, this indicates a bullish trend. If slow MAs have a downward trend and the price is below them, this indicates a bearish trend. Fast MAs are used to determine the strength of an existing trend. A trend is considered weak, if fast MAs move in the lateral direction or in the opposite direction with respect to slow MAs, the distance between fast and slow MAs is reduced. A strong trend is indicated by an increase in the distance between MA in one direction.
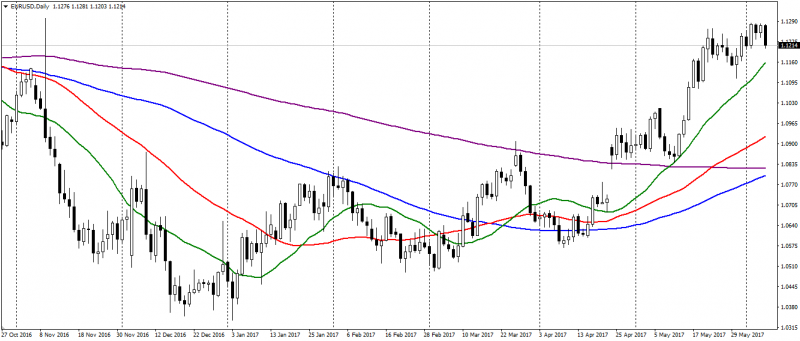
The figure shows an example of using this indicator, where the green line is MA 20, the red one is MA 50, the blue one is MA 100 and the violet one is MA 200.
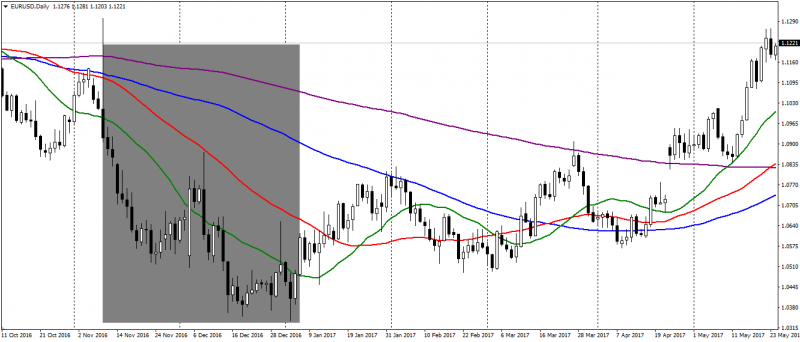
In the figure, a gray rectangle indicates a zone of a downward strong trend, which is indicated by an increase in the distance between MA. After that, the growth of MA 20 and MA 50 can be traced, which indicates a weakening of the existing trend. Later, in March, the crossing of three MA 20, 50 and 100 is traced, which indicates a change in trend. It was confirmed at the crossing of MA 200. And at the moment there is a strong uptrend on the market, as indicated by the upward dynamics of the four MAs and the growing distance between them.
The disadvantage of this method is the fact that it is lagging, since the MA itself is a lagging indicator. Therefore, this approach should be used with leading indicators such as: Stoch or RSI. Of the advantages, it is worth noting that this method is not very sensitive to market noise, which is very useful for volatile trading. It also allows you to see the main direction of the trend. And besides this, slow moving averange can be a significant support and resistance levels.
You can learn more about this method and not only during the training courses from Еster Holdings Inc.
Anton Hanzenko