
Corridor sentiments of USD/JPY. Trade in the flat continues.
Good day to all!
With you Andrew Green – the light at the end of the tunnel, for seekers – an outlet in the exchange trade.
For what I like the yen, it’s for the constant expectation of a surprise. The peculiarity of this currency is that it periodically trades in the corridors (flats), and very sharply emerges from them, passing to a higher or lower range, where it again enters the flat. All is well, it’s just very difficult to find the moment of this movement. But if you take the statistics, then about 70% of the time for the periods “week” and “day” the pair is traded in flat).
The fundamental analysis for this pair last week and, in the future, the next, is very meager.
The main dynamics for the pair are created by: US dollar movements, hedging operations of the international investment market and internal sentiments of exporters.
- For the US dollar, I recommend that you read the separate article on the DXY index and weekly prospects for USD.
- As for the international market, it is worth noting a sharp increase in the risk sentiment of investors, who were alerted by the sharp pullbacks of the United States stock market. To a large extent, it was this movement that gave support to the Japanese currency last week and allowed it to consolidate in the area of support lines for the current price corridor.
- Domestic exporters are very worried about the negative dynamics of their own market and are ready to start hedging their positions by buying the yen, if the breakdown of the 108.00 range occurs. So it is quite real there will be a sharp jump to the lower range with the prospect of moving to the levels of 103-105.00, in case of sharp price movements at the beginning of next week. Mostly everything is quiet.
We turn to a more applied study of the situation and our graphs.
Let’s start from afar: a week period (Figure # 1).
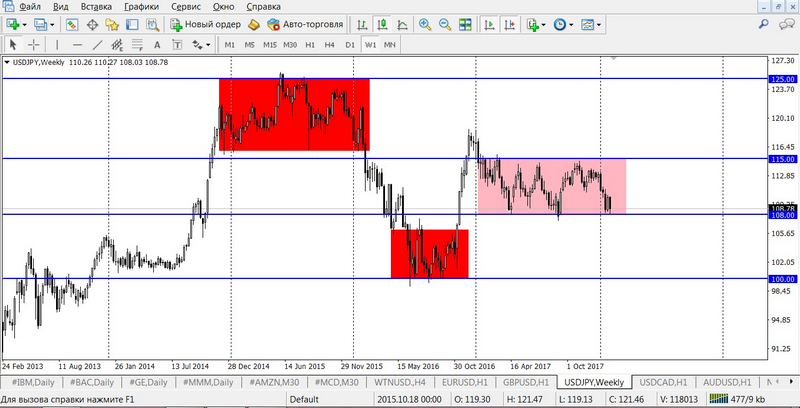
Here you can see exactly the channels that I wrote about. Current 108,00-115,00. There is nothing more to add, so move deeper and move on to the mid-term analysis of the daily timeframe in Figure 2.
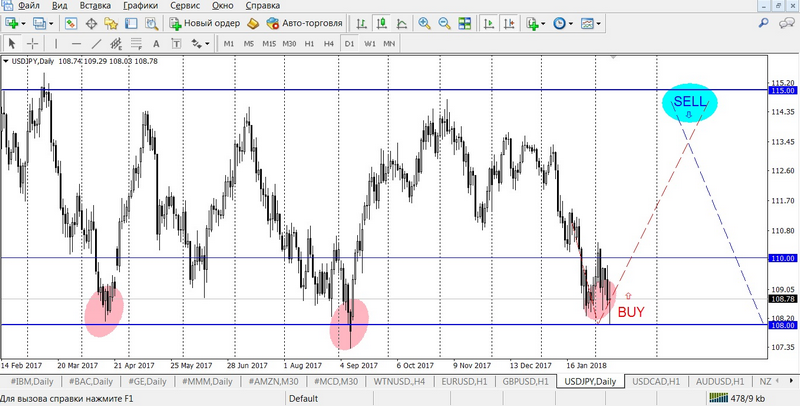
Here we see quite strong signals for reversal sentiments on the instruments. In general, a very strong area for the current purchases focusing on the zone 108.00-108.40, as the range of entry.
Who has not yet entered – enter, focusing on the signals of the market on the hourly chart (Figure # 3).
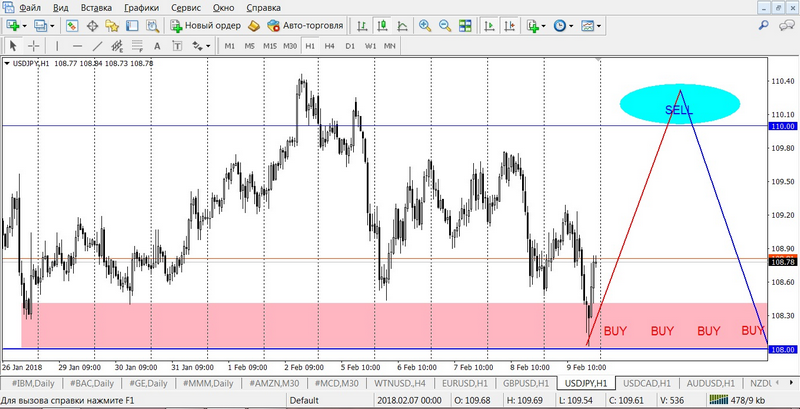
Here everything is clear – the red zone is the main range for purchases, the options for the nearest sales are not below levels 109,70-110,00.
Examples of transactions:
- BUY limit 108.30, SL 107.70, TP 109.10
- SELL limit 109.70, SL 110.40, TP 108.90
Do not forget about Stop Loss. This is not pleasant when the transaction closes at a loss, but it is the correct approach to controlling risks in asset management that makes you a professional in the financial market, not a player on the stock exchange.
Trading is not a casino. Stop playing and start earning.
Andrew Green