U.S. producer price data
- Core Producer Price Index (PPI) (m/m) (Aug), fact 0.3%, forecast 0.2%.
- Producer Price Index (PPI) (m/m) (Aug), fact 0.1%, forecast 0.1%.
Producer prices rose in August, indicating consumer inflation in the United States. But general dynamics of this indicator remains restrained.
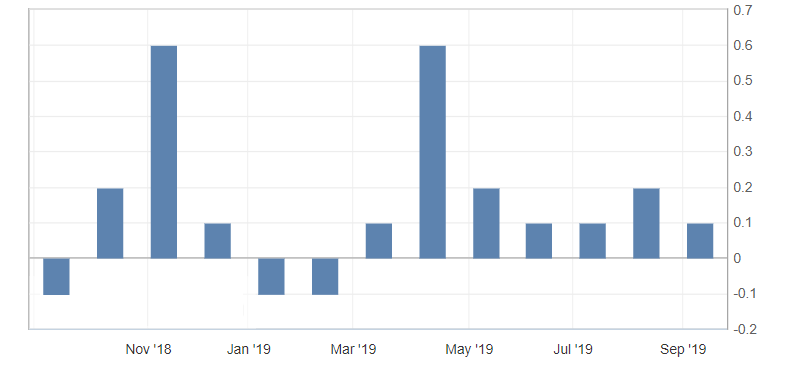
Fig. 1. US Producer Price Index Chart
In the context of the general strengthening of the US dollar, which can be traced from the European trading session, the limiting factor for the American dollar was Trump’s statement to the US Federal Reserve, which stated the need to reduce interest rates to zero or lower.
The US dollar index came out of the side channel on the growth of optimism, but now it is limited to overbought and resistance zone 98.70-80. Support is located at 98.50-40.
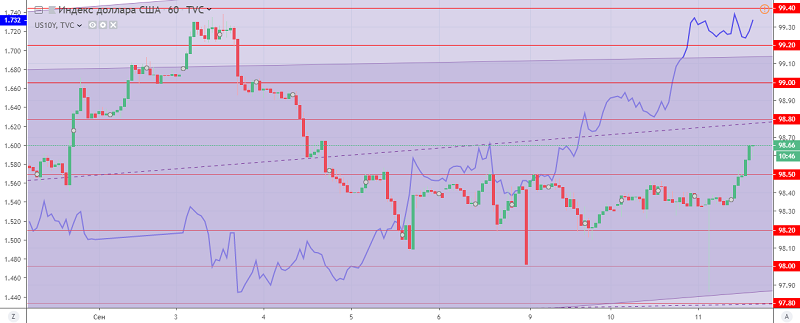
Fig. 2. US dollar index chart. Current price – 98.60 (10-year US government bonds yield – blue line)
Read also: “The oil market and its cloudy prospects”
Hanzenko Anton
Earn with the help of the trade service on the news Erste News!
Topical articles of the trader’s blog:
- The British pound is growing on Johnson’s failures
- Boris Johnson leads the UK to a tough Brexit
- Currency is a weapon in a trade war!
Current Investment ideas: