
Australian-Chinese vinaigrette. Analysis of the structural relationships of the Australian dollar and a weekly review for the pair AUD/USD.
Good afternoon dear friends. With you Andrew Green.
When you are engaged in a full analysis of the market, and in your arsenal of more than one financial instrument, then in one trading day you manage to fly around in your mind the whole world. Starting with the old Europe and its fairly quiet markets. Here you filled with the winds of London, Paris, Berlin, Frankfurt and you plunge into what breathe these cities and countries.
If you are interested in oil, then a couple of hours you are already on the stock markets of Riyadh, Tel Aviv, Dubai and Istanbul. With my imagination, I sometimes feel the heat and the atmosphere of the sun-tired east, and their leisurely trade and a very sedate reaction to the publication of news.
When Europe enters its after-dinner, sleepy, practically devoid of news routine, which in Spain and Greece is called the “siesta”, and practically fades, with a noise worthy of Armageddon, aggression of youth and a constant thirst for a new one, the American world, led by the stock market, the US market. During this period of the day life spills over the edge, filling the financial market with news, events, opinions. About New York they say that this is a city that never sleeps. A little paraphrasing, I can say that the American stock session – will not let anyone fall asleep).
And only after 21:00 UTC the market does not fall asleep, but I just have an opinion that they are simply turned off by force). And then it seems that peace has finally come, but this is only an illusion. It’s just the time of other countries and continents: the unknown New Zealand, then Australia and exotic Japan, the great and quiet China. The market never sleeps, it lives its own order, changing the destinies of millions and billions per day.
Studying the economic ties of Australia and the established correlations of the Australian dollar, I sometimes think that this is the most dependent monetary unit in the world).
- direct dependence on the prices of raw materials in the mining segment (Australia is one of the world’s largest miners and processors of mining material);
- direct dependence on Gold (Australia is among the world’s 10 largest producers of this metal);
- direct dependence on oil (the largest producer of this energy resource in the region);
- dependence on China’s economic performance (strategic partnership) …
And this is not all external factors.
In general, the fundamental analysis of the pair is not simple). I recommend that you familiarize yourself with the weekly review of oil, as well as the prospects for the US dollar in the near future.
Now let’s analyze our own news and fundamental factors, which should be noted this week.
The Reserve Bank of Australia has made it quite clear that it does not plan to somehow change the monetary policy in the region in the near future. The reasons for such restrained behavior against the background of the rest of the market participants were low inflation, as well as persisting and even growing risks from the instability of the growth of the Chinese economy as the main consumer of resources and raw materials in the region.
In the week, it is worth paying attention to the RBA minutes, which will be published on Tuesday 20.02.18, at 00:30 UTC, as well as data from the construction industry, completed facilities to be published on Wednesday 21.02.18, at 00:30 UTC. On this day, there will also be news with data on salaries and an index of leading indicators from the Conference Board at 15:30 UTC.
It is quite possible that this news will have a positive effect. But they are unlikely to have a serious impact on the overall dynamics of the pair.
When I come across such a multifacetedness of fundamental factors, I concentrate my attention on the specifics of technical analysis.
Perhaps, we will begin, as usual, with the older timeframes. Figure #1 and weekly candles.
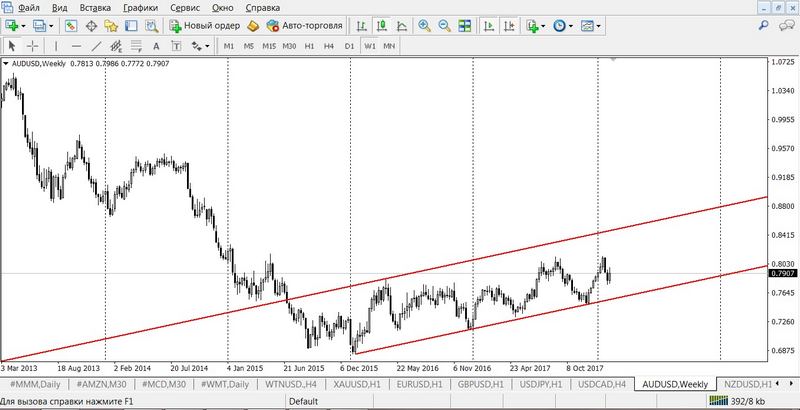
Here everything is calm and obvious – a growing trend with movement in the zone close to the support line. According to the rules of trend analysis in such cases, the maximum emphasis on transactions in the continuation of the trend. The key support zone in this trend is the levels of 0.76-0.77. As for the benchmarks for growth and possible resistance – 0.85-0.86. I do not observe anything more interesting. If you have a desire to more deeply study trend analysis as a technical section, I suggest and recommend that you take an individual training course from the partner company Ester.
[maxbutton id = “2” url = “https://esterholdings.com/en/learning/paid-training/modul-adaptive/#modal-1” text = “JOIN THE COURSE!” ]
We pass to the day period and Figure # 2. It’s more interesting here.
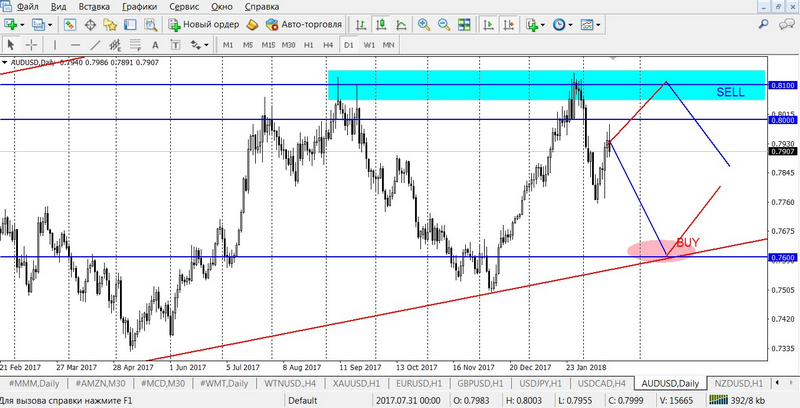
The price is in the middle of the range between two strong medium-term resistance lines 0.8100 and support of 0.7600. Yes, the range is certainly not small, 500 points. But for the medium-term trade just what you need.
For traders, who wants everything, immediately and today, to amateurs and professionals of intraday, it is worth to carefully study Figure #3 and hour timeframe.
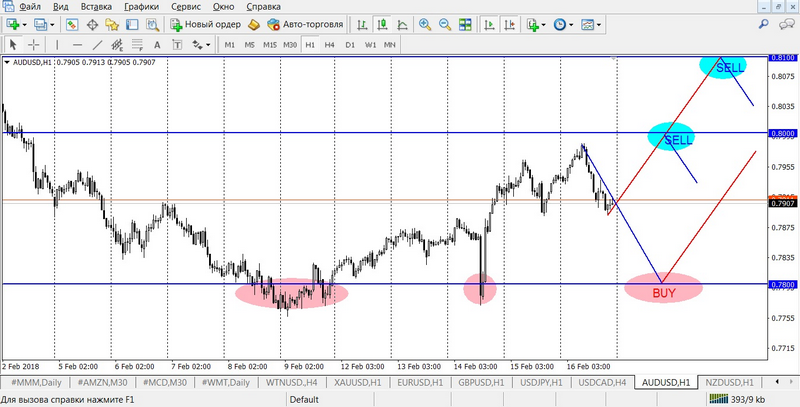
As we see on the chart, we have two resistance ranges with blue zones for sales of 0.8000 and 0.8100, as well as strong support and a pink zone for purchases at 0.7800. It is from these levels and we will consider the benchmarks for trade with 30-40-point goals.
Examples of transactions:
- SELL limit 0.7990, SL 0.8020, TP 0.7950
- SELL limit 0.8090, SL 0.8150, TP 0.8010
- BUY limit 0.7810, SL 0.7770, TP 0.7880
If you have any questions about this review, or have specific recommendations and requests for technical analysis, please write to support@esterholdings.com with a note “for Andrew Green”.
Trade is a business not only for buttoned up white collars, here everyone will find his portion of happiness.
Andrew Green