American roller coaster of the Canadian dollar. Overview of the pair USD/CAD for a week.
Good afternoon dear friends. With you, Andrew Green, a financial analyst and
observer of the international currency market ForEx.
When I start to trade on the Canadian dollar, I always have the impression that I am coming to a psychiatric hospital. Only sometimes as a doctor, and sometimes as a patient). It is interesting that in the beginning, when you go into a transaction – I feel always like a doctor, but when leave it – everything is already back to normal mode. This, of course, is a joke).
Last week for the Canadian dollar was relatively predictable, it traded in a standard reference to the commodity market and the general dynamics of oil (Figure # 1).
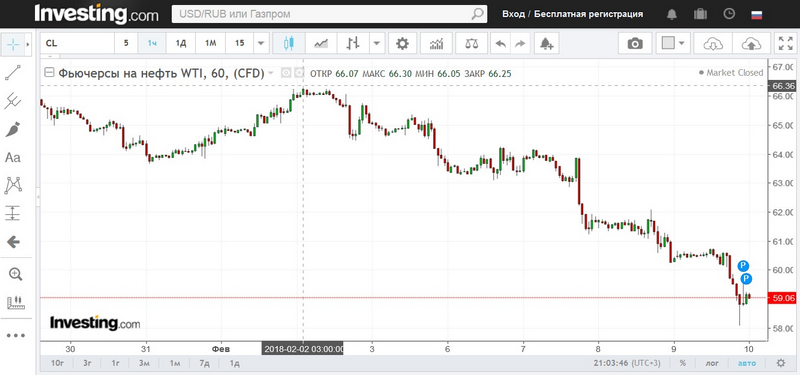
Taking into account that oil has fallen in price by almost 10 percent, having fallen below 60 USD (WTI), the Canadian dollar paired with the US dollar (USD/CAD) also went up about 400 points.
In addition to oil, the rest of the Canadian movement is the “unfavorable” influence of the nearest neighbor.
What can one wait this week?
Mostly everything remains, as it was last week. There is practically no news background on Canada. For oil, we are waiting for a weekly report on the reserves of black gold in the United States. For a detailed analysis of the dollar, read the article with an analysis of the USD-DXY composite index.
After a small portion of the fundamental analysis, we go to the technique. And, perhaps, we’ll start with the daytime timeframe (Figure # 2).
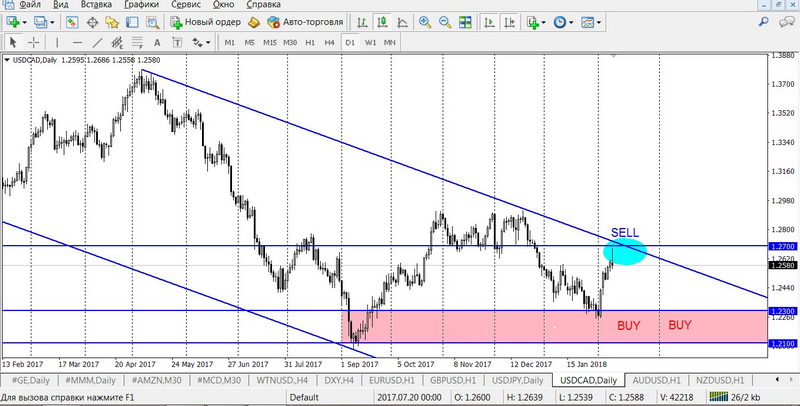
Here, events unfold in a downward trend channel, in a zone close to the resistance line. The main benchmark for the level of 1.2700. Given the direction of the trend, just sales from 1.2700 and will be a good guide for trading this week. I would recommend starting averaging from 1.2600 with a range of 40 points. The line of trade exclusion and stop loss at the levels of 1.2760 and above.
As for purchases, the medium-term target is the range 1.2300-1.2100. We start buying and averaging from 1.2300 with a range of 50 points. Cut-off line -1.1950.
For intraday traders, all attention is drawn to Figure # 3 and the timeframe of H4, at the moment it shows the most convenient option for trading.
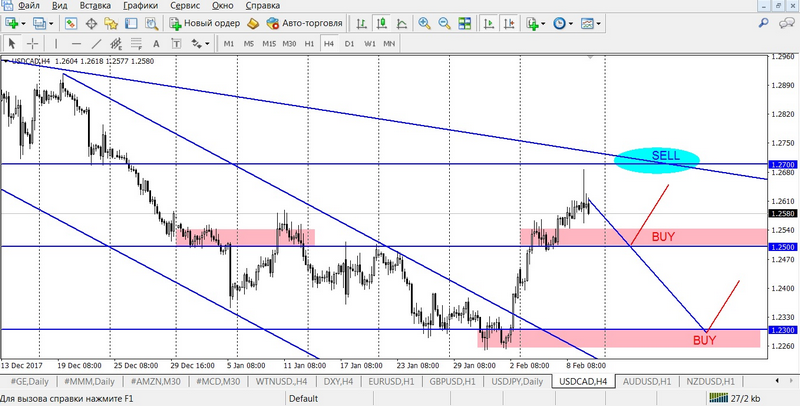
We are witnessing a breakthrough in the downward trend, which began to form as early as the 20th of last month. After the re-test of level 1.2300, a turn was formed and the pair gave a strong pullback with the breakdown of the resistance line of the channel. In a greater degree, there are all signs of the formation of a short-term ascending channel, but not enough of at least a couple of downward corrections. As you can see on the chart, I identified two options for purchases:
- aggressive, based on the formation of an upward trend and sufficient support for the psychological level of 1.2500;
- conservative, full rollback to support levels 1.2300.
In turn, sales are guided by the achievement of the medium-term resistance zone at 1.2700.
Examples of transactions:
- aggressive:
BUY limit 1.2510, SL 1.2460, TP 1.2580; - conservative:
BUY limit 1.2310, SL 1.2230, TP 1.2390;
SELL limit 1.2690, SL 1.2750, TP 1.2610.
To trade in the market, sometimes you need to look in someone’s eyes crazy,
while being a doctor inside. Do not give in to the general mood of the market,
trade, independently making decisions.
Andrew Green