
U.S. data
- GDP (q/q) (Q2), fact 2.0%, forecast 2.0%.
- GDP deflator (q/q) (Q2), 2.5% fact, 2.4% forecast.
- Trade balance (July), fact -72.34B, forecast -74.00B.
- Initial jobless claims, fact 215K, forecast 215K.
- Inventories in retail trade excluding automobiles (July), fact 0.3%, previous value -0.2%
Published data on the United States were very restrained positive. Of particular note is the US GDP deflator, which indicates a rise in consumer inflation. The positive dynamics was also shown by the trade balance, which remains near annual lows. Reserved negative data showed data on applications for benefits and growth in stocks of goods in retail.
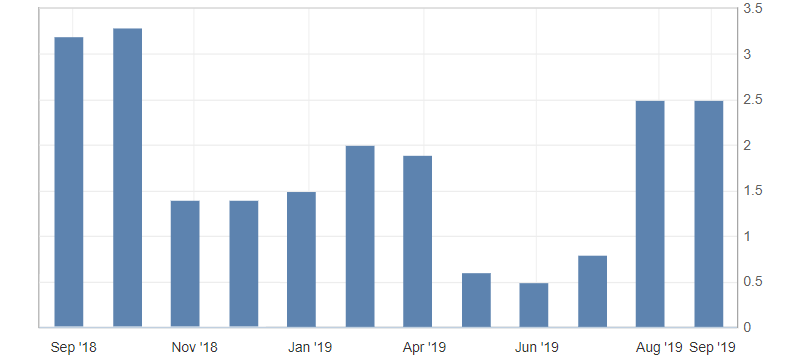
Fig. 1. U.S. GDP deflator chart
As a result, published data on the United States can be regarded as restrained positive. Due to the growth of optimism, the market is prone to buying risky assets. The US dollar index maintains an upward trend, limited by the resistance level of 98.30. Given the current sentiment and a further increase in the US government bonds yield, we should expect a strengthening of the US dollar index to resistance levels: 98.40 and 98.50. Support are the marks: 98.10 and 98.00.
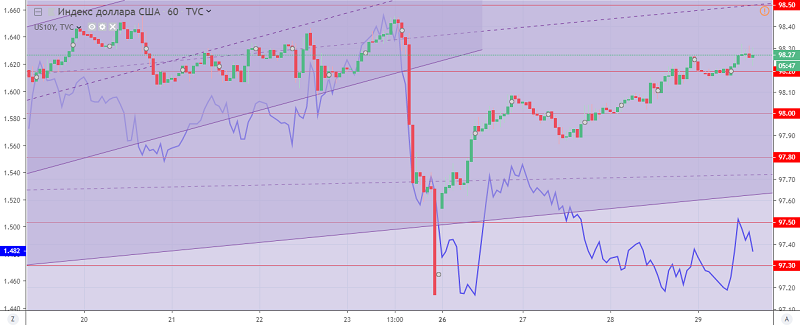
Fig. 2. The US dollar index chart. Current price – 98.30 (10-year US government bonds yield – blue line)
Read also: “Stock Indices: Storming Historic Highs”
Hanzenko Anton
Earn with the help of the trade service on the news Erste News!
Topical articles of the trader’s blog:
- What does the US Fed Chairman Powell statement mean for the US dollar
- ECB is preparing a stimulus package
- The national currency exchange rate as an advantage in trade talks
Current Investment ideas: