
Butterfly Strategy – A Universal Approach to Trade. Anton Hanzenko.
The Butterfly Strategy uses the Gartley Butterfly Pattern and the Fibonacci lines. It is a multimedia strategy and can be used for any currency pairs and timeframes. The strategy has a clear model with certain mathematical ratios that are calculated on a Fibonacci lines.
The Gartley Butterfly Pattern gives a fairly good signal to enter a trade with a high degree of working out. This figure is a continuation pattern of an already existing trend, which makes it possible to enter the market at the most favorable price.
An example of a bullish Gartley Butterfly Pattern:
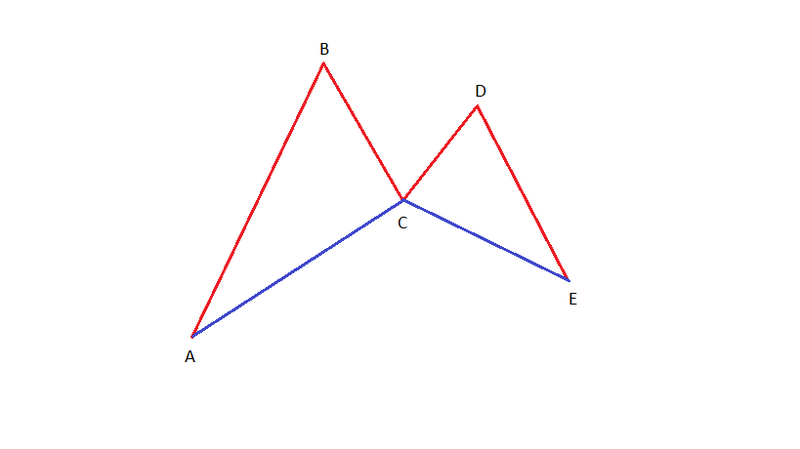
The figure shows the price movement (the red lines) on the price chart.
Point A is the beginning of the harmonic Butterfly pattern.
AB is the upward move from minimum A to maximum B. It has to be an impulse move and not contain flat. The AB segment is the basis of the Butterfly pattern, in this segment we use Fibonacci levels, from low to high. The Fibonacci indicator should contain the following levels: 0%; 23.6%; 38.2%; 50.0%; 61.8%; 78.6% and 100.0%.
BC is the correctional move of the AB segment. Point C should be in the area of Fibonacci levels from 50.0% to 61.8%. If point C does not lie in this area, then this is not the Butterfly pattern. If point C has rebounded from the level of 50.0%, this is a good signal.
CD is an upward move and direction in the same direction as AB. At the same time, point D must be located in the area of Fibonacci levels from 61.8% to 78.6%, built on the segment from B to point C.
DE is the second downward corrective move. Point E must be in the area of Fibonacci levels from 61.8% to 78.6%, constant on the segment from A to point B. Also, point E must be in the area of Fibonacci levels from 127.2% to 161.8% from C to point D.
Of course, the construction of this pattern may seem very difficult, but after a little practice it is built very quickly and accurately. As a result, we get a closed cycle of price constructions. If some retio does not match, the pattern is not implemented.
The entry into the transaction (1) for the purchase is the point E, or rather the Fibonacci level breaking through is 61.8%. Here you can use a pending buy order.
A more conservative entry into the transaction is also possible (2). In this case, Stop — Loss will be larger, but confidence in the deal will also increase. A more conservative entry into the transaction is carried out by breaking the trend line, which is based on point D and the local high, which was formed after point E.
Stop — Loss is set slightly below the Fibonacci level of 78.6%, built on the interval from A to point B. Stop — Loss depends on the particular currency pair taken and the market volatility at the moment.
Take profit is set at the level of point D (conservative) or point B (more risky) depending on the market condition.
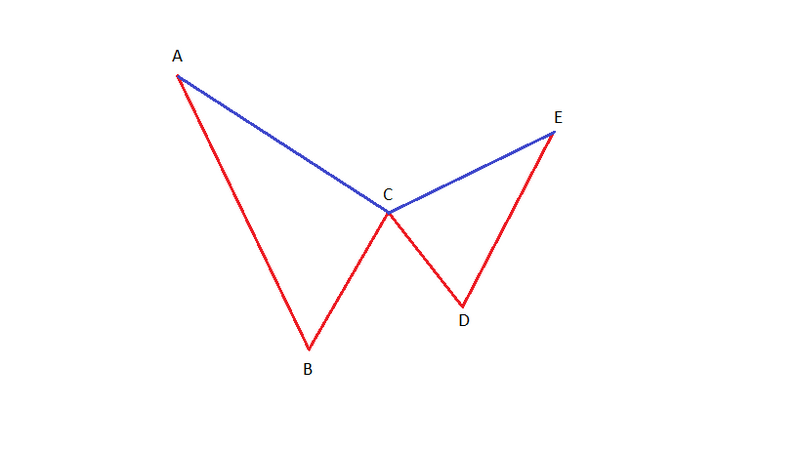
For deals to sell, a bearish pattern with reverse conditions is used.
An example of the Gartley Butterfly bearish pattern:
Consider an example of entering a trade on the Butterfly bullish pattern.
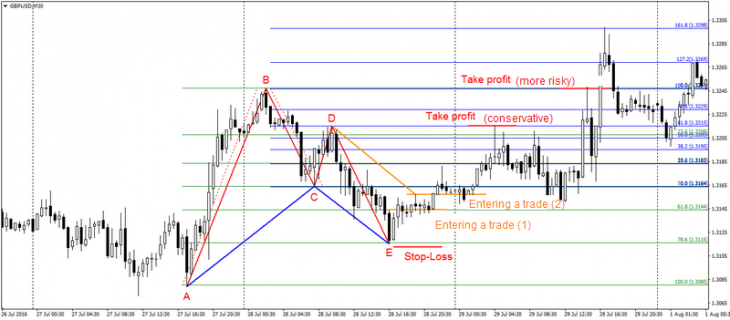
Despite the fact that the entry into the transaction (1) differs from the entry into the transaction (2) by only 15 points, the second entry option looks more confident. Conservative Take profit is achieved much faster and with smaller drawdowns.
The correct Butterfly pattern is very rare, but if you recognize it, and it will meet all the requirements, it will allow you to open a profitable deal confidently.
Read also the article “Trading Strategy “EBB 1″- Envelopes and Bollinger Bands.”
Anton Hanzenko