
U.S. data
- Core durable goods orders (m/m) (December), fact 0.1%, forecast 0.2%.
- Durable goods orders (m/m) (December), fact 1.2%, forecast 0.8%.
- Initial jobless claims, fact 216K, forecast 220K.
- Philadelphia Fed manufacturing index (Feb), fact -4.1, forecast 15.6.
U.S. data was very mixed. Thus, the number of initial claims for unemployment benefits in the US in February showed a smaller increase than expected, especially after a surge in applications for three consecutive weeks. The negative dynamics was shown in core durable goods orders and manufacturing activity index from Philadelphia Fed. A noticeable decline was demonstrated by manufacturing activity, which fell to the lows of the last three years, pointing to the negative dynamics of the US manufacturing sector.
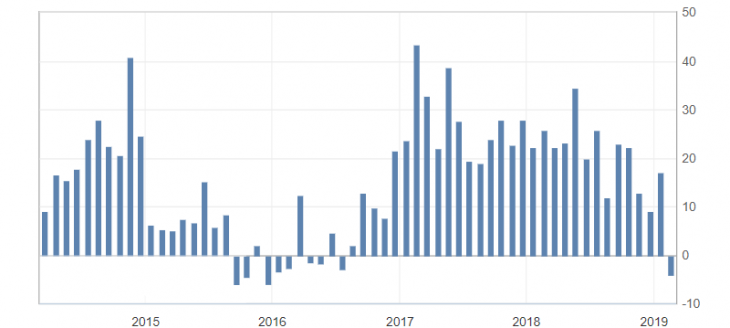
Fig. 1. U.S. Philadelphia Fed manufacturing activity index chart
The US dollar index took the US data block very negatively, which accelerated the decline against the basket of competitors, pointing to the yesterday’s repeated test at 96.30 and the resumption of the downward trend.
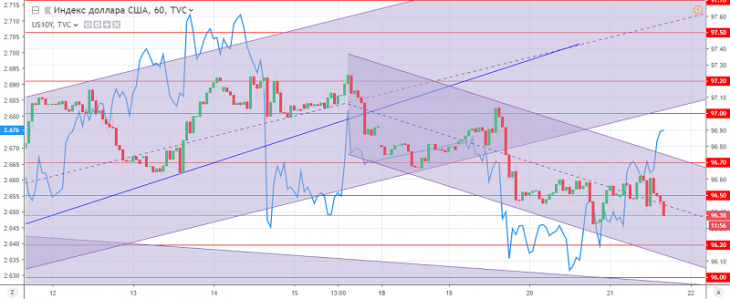
Fig. 2. The US dollar index chart. The current price is 96.40 (10-year government bonds yield is the blue line)
Read also: “Safe Haven – security tools in financial markets”
Hanzenko Anton
Earn with the help of the trade service on the news Erste News!
Topical articles of the trader’s blog:
- Gold. Expectations March 2019!
- Gold. Expectations for February and March 2019
- Features of trading within a week
Current Investment ideas: