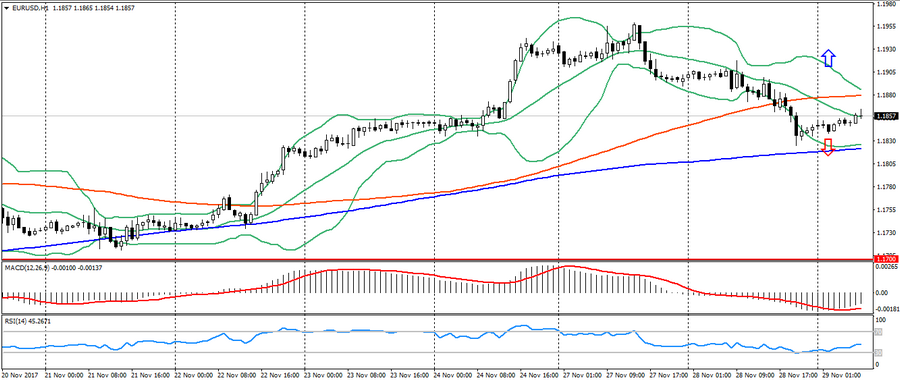
EUR USD (current price: 1.1870)
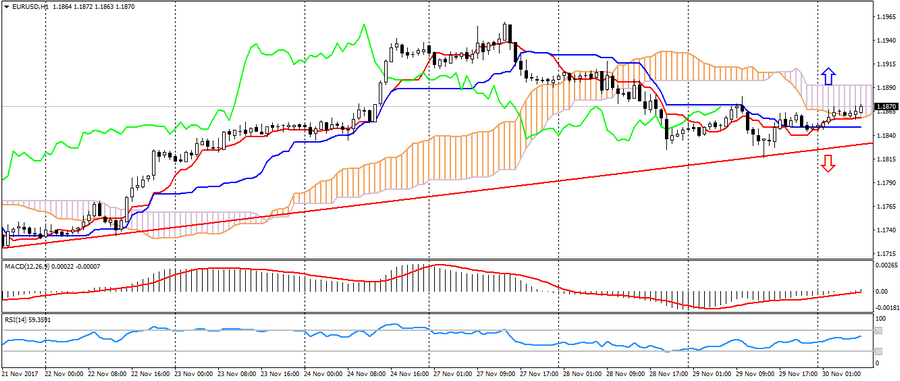
- Support levels: 1.1700 (August 2015 maximum), 1.1600 (2016 maximum), 1.1470.
- Levels of resistance: 1.2000, 1.2100, 1.2270 (November 2014 minimum).
- Computer analysis: MACD (12, 26, 9) (signal – upward movement): the indicator is above 0, the signal line is in the body of the histogram. RSI (14) is in the neutral zone. Ichimoku Kinko Hyo (9, 26, 52) (flat signal): the Tenkan-sen line is higher than the Kijun-sen line, but the price is in the cloud.
- The main recommendation: sale entry is started from 1.1880 (MA 100), 1.1910, 1.1950.
- Alternative recommendation: buy entry is started from 1.1820 (MA 200), 1.1800, 1.1780.
The euro is trading with a small strengthening on the correction after yesterday’s decline, but keeps the overall upward trend.
GBP USD (current price: 1.3460)
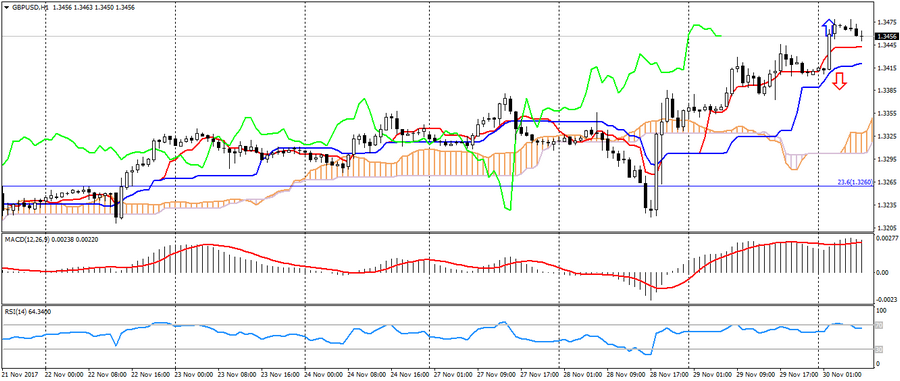
- Support levels: 1.3140, 1.2900, 1.2740 (August 2017 minimum).
- Resistance levels: 1.3500, 1.3660, 1.3830 (February 2016 minimum).
- Computer analysis: MACD (12, 26, 9) (signal – upward movement): the indicator is above 0, the signal line is in the body of the histogram. RSI (14) is in the overbought zone. Ichimoku Kinko Hyo (9, 26, 52) (signal – upward movement): the Tenkan-sen line is above the Kijun-sen line, the price is higher than the cloud.
- The main recommendation: sale entry is started from 1.3480, 1.3500, 1.3540.
- Alternative recommendation: buy entry is started from 1.3440, 1.3400, 1.3250 (MA 100).
The British pound maintains a positive momentum on the data on the progress of negotiations between the EU and the UK. The pair remains in a significant overbought zone.
USD CHF (current price: 0.9840)
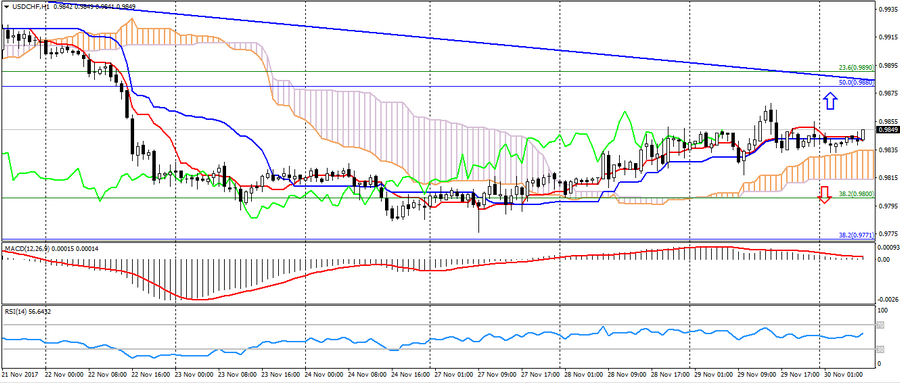
- Support levels: 0.9700, 0.9600, 0.9530.
- Resistance levels: 1.0000, 1.0050, 1.0100 (May maximum).
- Computer analysis: MACD (12, 26, 9) (signal – downward movement): the indicator is above 0, the signal line has left the body of the histogram. RSI (14) is in the neutral zone. Ichimoku Kinko Hyo (9, 26, 52) (signal – descending movement, flat): the Tenkan-sen line is below the Kijun-sen line, the price is higher than the cloud.
- The main recommendation: sale entry is started from 0.9860 (MA200), 0.9880 (Fibo.50.0 from the high of November 2016), 0.9900.
- Alternative recommendation: buy entry is started from 0.9820 (MA 100), 0.9800, 0.9770 (Fibo 38.2 from the high of November 2016).
The Swiss franc is trading in flat, but the overall downtrend persists in the pair.
USD JPY (current price: 112.20)
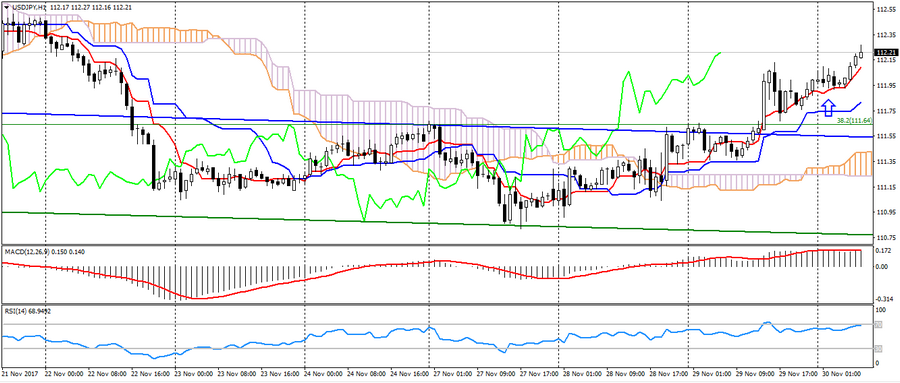
- Support levels: 108.90, 108.10 (April 2017 minimum), 107.30 (2017 minimum).
- Resistance levels: 113.70, 114.50 (July 2017 maximum), 115.00.
- Computer analysis: MACD (12, 26, 9) (signal – upward movement): the indicator is above 0, the signal line is in the body of the histogram. RSI (14) is in the overbought zone. Ichimoku Kinko Hyo (9, 26, 52) (signal – upward movement): the Tenkan-sen line is above the Kijun-sen line, the price is higher than the cloud.
- The main recommendation: sale entry is started from 112.50 (MA 100 to H4), 112.70, 113.00 (Fibo.50.0 from the maximum of December).
- Alternative recommendation: buy entry is started from 111.80, 111.60 (Fibo. 38.2 from the maximum of December), 111.30.
The Japanese yen remains in a downward trend on the general growth of demand for risky assets.
USD CAD (current price: 1.2870)
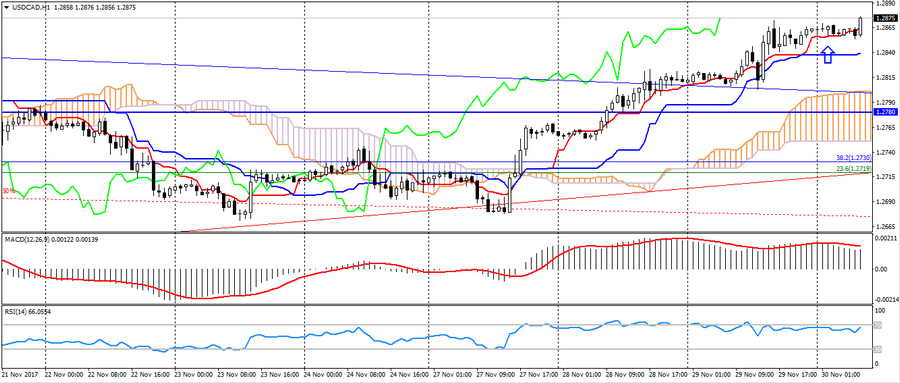
- Support levels: 1.2200, 1.2060 (2017 minimum), 1.1950 (2015 minimum).
- Resistance levels: 1.2780 (August 2017 maximum), 1.3000, 1.3160.
- Computer analysis: MACD (12, 26, 9) (signal – downward movement): the indicator is above 0, the signal line has left the body of the histogram. RSI (14) is in the overbought zone. Ichimoku Kinko Hyo (9, 26, 52) (signal – upward movement): the Tenkan-sen line is above the Kijun-sen line, the price is higher than the cloud.
- The main recommendation: sale entry is started from 1.2880, 1.2900, 1.2920.
- Alternative recommendation: buy entry is started from 1.2820, 1.2800, 1.2780.
The Canadian dollar remains under pressure from the general strengthening of the American, but further growth is limited by the maturing divergence.
AUD USD (current price: 0.7570)
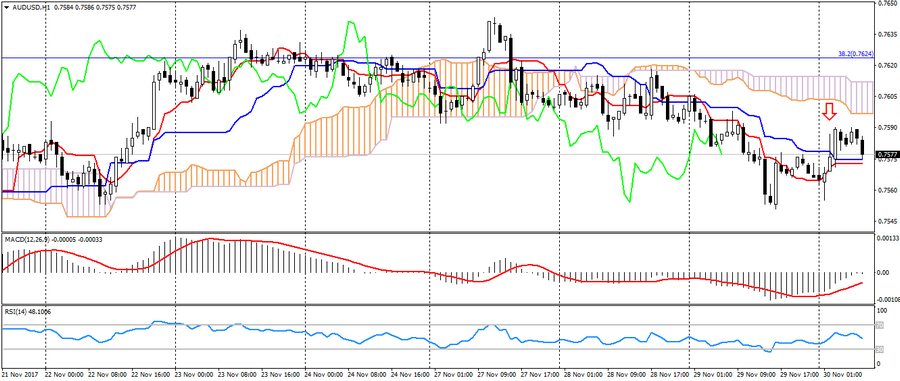
- Support levels: 0.7740, 0.7320 (2017 minimum), 0.7120.
- Resistance levels: 0.8120 (2017 maximum), 0.8200, 0.8290 (2014 maximum).
- Computer analysis: MACD (12, 26, 9) (signal – upward movement): the indicator is below 0, the signal line has left the body of the histogram. RSI (14) is in the neutral zone. Ichimoku Kinko Hyo (9, 26, 52) (signal – downward movement): the Tenkan-sen line is below the Kijun-sen line, the price is below the cloud.
- The main recommendation: sale entry is started of 0.7600, 0.7630 (Fibo. 38.2 from the low of January 2016), 0.7650.
- Alternative recommendation: buy entry is started 0.7570, 0.7550, 0.7530.
The Australian is trading in different directions on positive data on Australia and the growth of the American.
NZD USD (current price: 0.6840)
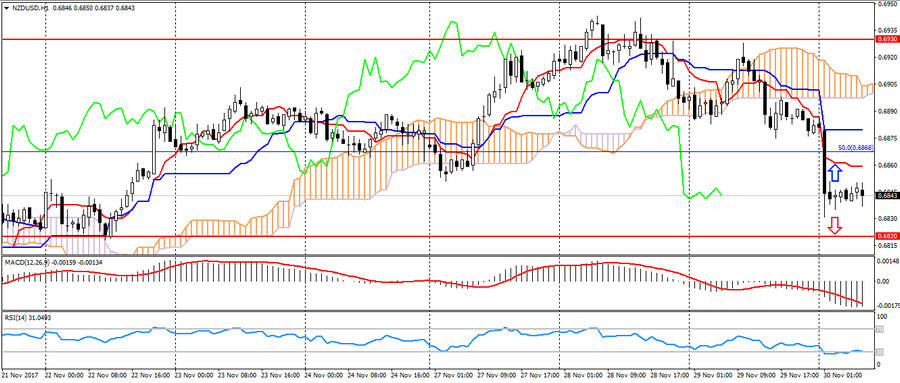
- Support levels: 0.7000, 0.6930, 0.6820 (the minimum of the current year).
- Resistance levels: 0.7380, 0.7450, 0.7550 (2017 maximum).
- Computer analysis: MACD (12, 26, 9) (signal – downward movement): the indicator is below 0, the signal line is in the body of the histogram. RSI (14) is in the oversold zone. Ichimoku Kinko Hyo (9, 26, 52) (signal – downward movement): the Tenkan-sen line is below the Kijun-sen line, the price is below the cloud.
- The main recommendation: sale entry is started from 0.6850, 0.6870 (MA 200), 0.6890.
- Alternative recommendation: buy entry is started from 0.6830, 0.6800, 0.6780.
The New Zealand dollar remains in flat after a significant decline early in the day on weak business data on New Zealand.
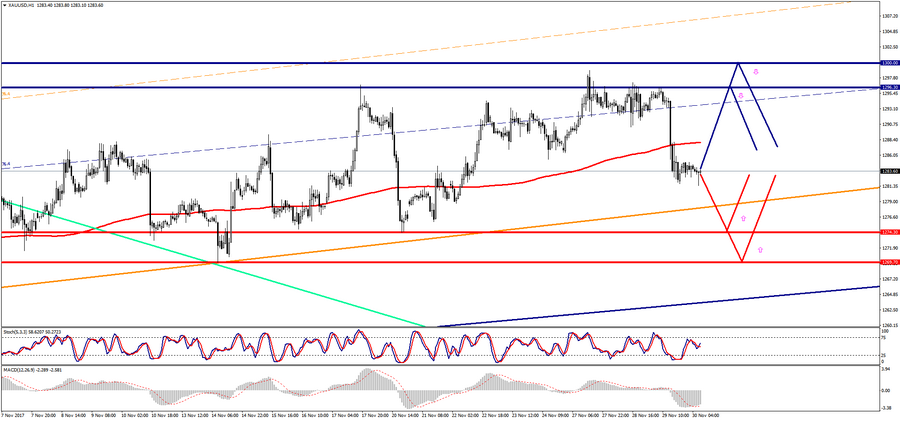
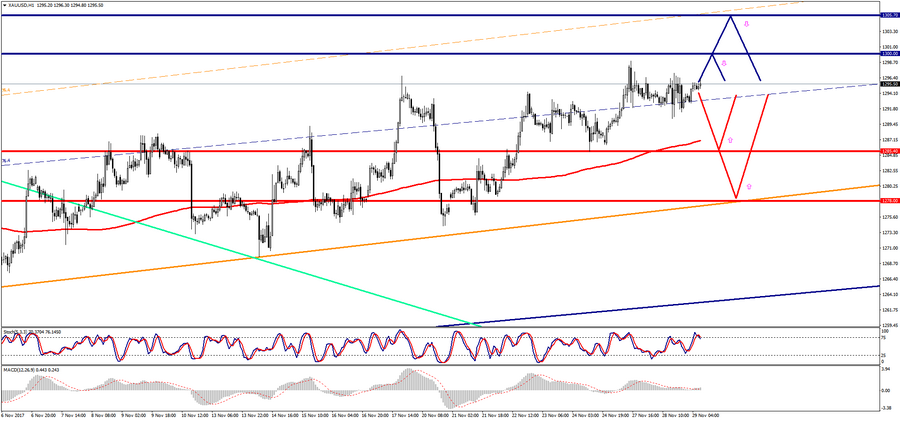
XAU USD (current price: 1282.00)
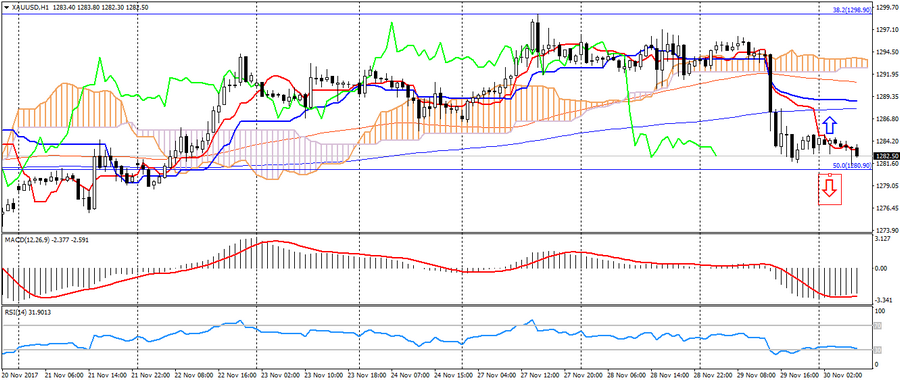
- Support levels: 1250.00, 1226.00, 1200.00.
- Resistance levels: 1340.00, 1355.00, 1374.00 (2016 maximum).
- Computer analysis: MACD (12, 26, 9) (signal – upward movement): the indicator is below 0, the signal line left the body of the histogram. RSI (14) is in the oversold zone. Ichimoku Kinko Hyo (9, 26, 52) (signal – downward movement): the Tenkan-sen line is below the Kijun-sen line, the price is below the cloud.
- The main recommendation: sale entry is started from 1288.00 (MA 200), 1291.00, 1297.00.
- Alternative recommendation: buy entry is started from 1281.00 (Fibo 50.0 from the July low), 1278.00, 1274.00 (MA 200).
Gold is trading near significant support (1281.00) after yesterday’s decline.