技术分析

Technical analysis of cross-rates. (Anton Hanzenko)

EUR GBP (current price: 0.8820)

  • Support levels: 0.8730 (minimum of the last months), 0.8650, 0.8530.
  • Resistance levels: 0.9020, 0.9170, 0.9300 (the maximum of the current year).
  • Computer analysis: MACD (12, 26, 9) (signal – upward movement): the indicator is below 0, the signal line has left the body of the histogram. RSI (14) is in the neutral zone. Ichimoku Kinko Hyo (9, 26, 52) (signal – downward movement): the Tenkan-sen line is below the Kijun-sen line, the price is below the cloud.

Technical Analysis of Oil (Alexander Sivtsov)

Oil is traded slightly above the zero mark during the Asian session.

The Brent graph (current price: $ 6791.80 per 100 barrels)

The Bent brand is traded slightly above the zero mark during the Asian session.

Technical Analysis of Oil (Alexander Sivtsov)

Oil is traded slightly above the zero mark in the Asian session.

The Brent graph (current price: $ 6752.40 per 100 barrels)

The Brent brand is traded slightly above the zero mark during the Asian session.

Тechnical analysis of currency pairs (Anton Hanzenko)

EUR USD (current price: 1.2010)

  • Support levels: 1.1700 (August 2015 maximum), 1.1600 (2016 maximum), 1.1470.
  • Resistance levels: 1.2000, 1.2100, 1.2270 (November 2014 minimum).
  • Computer analysis: MACD (12, 26, 9) (signal – downward movement): the indicator is below 0, the signal line is in the body of the histogram. RSI (14) is in the zone of oversold oversold. Ichimoku Kinko Hyo (9, 26, 52) (signal – downward movement): the Tenkan-sen line is below the Kijun-sen line, the price is below the cloud.

Technical analysis of cross-rates. (Anton Hanzenko)

EUR GBP (current price: 0.8860)

  • Support levels: 0.8730 (minimum of the last months), 0.8650, 0.8530.
  • Resistance levels: 0.9020, 0.9170, 0.9300 (the maximum of the current year).
  • Computer analysis: MACD (12, 26, 9) (signal – downward movement): the indicator is below 0, the signal line is in the body of the histogram. RSI (14) is in the oversold zone. Ichimoku Kinko Hyo (9, 26, 52) (signal – downward movement): the Tenkan-sen line is below the Kijun-sen line, the price is below the cloud.

Technical Analysis of Oil (Alexander Sivtsov)

Oil is traded near zero marks during the Asian session.

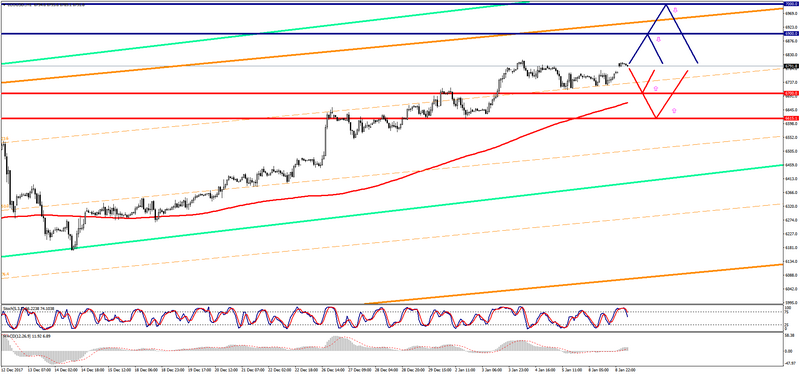
The Brent graph (current price: $ 6786.50 per 100 barrels)

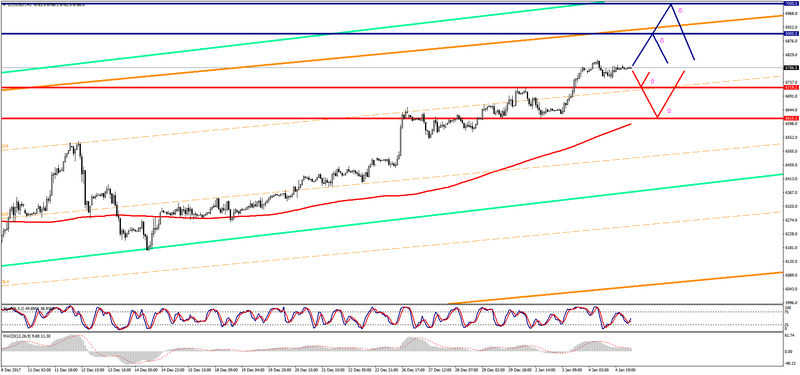
The Brent brand is traded slightly below the zero mark during the Asian session.

  • Resistance 1: From $ 6900.00 (psychological level)
  • Resistance 2: From $ 7000.00 (psychological level)
  • Support 1: From $ 6719.20 (January 2 maximum)
  • Support 2: From $ 6615.10 (January 2 minimum)

Computer analysis: The Stochastic Oscillator movings on the charts of H1 and H4 are in the neutral zone, the consolidation of the Brent price is possible.

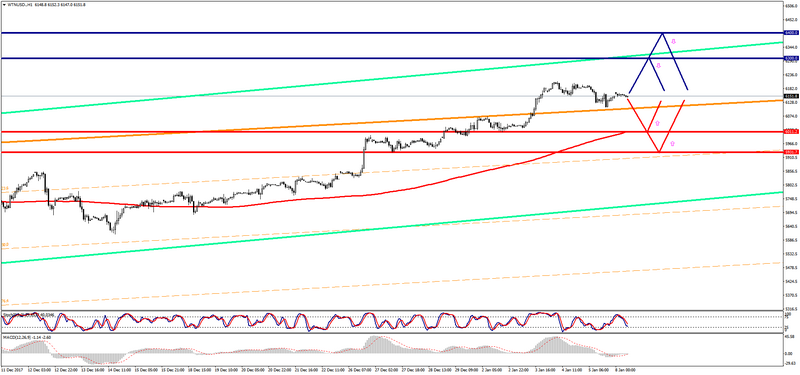
The WTI graph (current price: $ 6188.90 per 100 barrels)

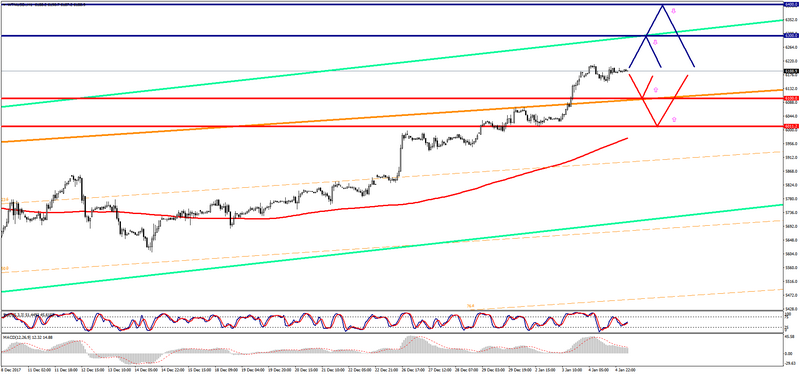
The WTI brand is traded with a small minus during the Asian session.

  • Resistance 1: From $ 6300.00 (psychological level)
  • Resistance 2: From $ 6400.00 (psychological level)
  • Support 1: From $ 6100.00 (psychological level)
  • Support 2: From $ 6011.20 (January 2 minimum)

Computer analysis: The Stochastic Oscillator movings on the charts of H1 and H4 are in the neutral zone, one should expect the continuation of the consolidation of the WTI price.

Тechnical analysis of currency pairs (Anton Hanzenko)

EUR USD (current price: 1.2060)

  • Support levels: 1.1700 (August 2015 maximum), 1.1600 (2016 maximum), 1.1470.
  • Resistance levels: 1.2000, 1.2100, 1.2270 (November 2014 minimum).
  • Computer analysis: MACD (12, 26, 9) (signal – downward movement): the indicator is above 0, the signal line has left the body of the histogram. RSI (14) is in the neutral zone. Ichimoku Kinko Hyo (9, 26, 52) (signal – upward movement): the Tenkan-sen line is above the Kijun-sen line, the price is higher than the cloud.