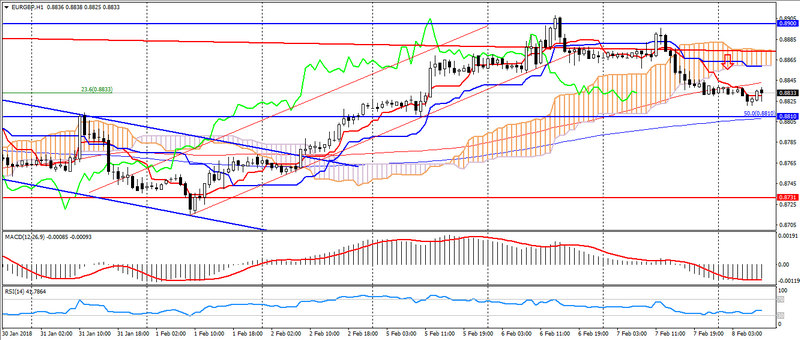
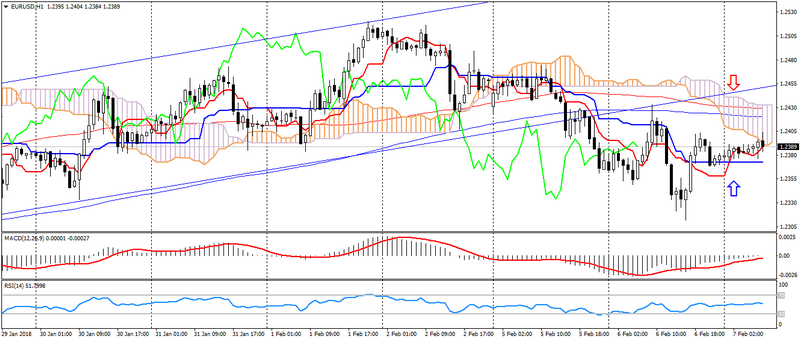
EUR USD (current price: 1.2280)
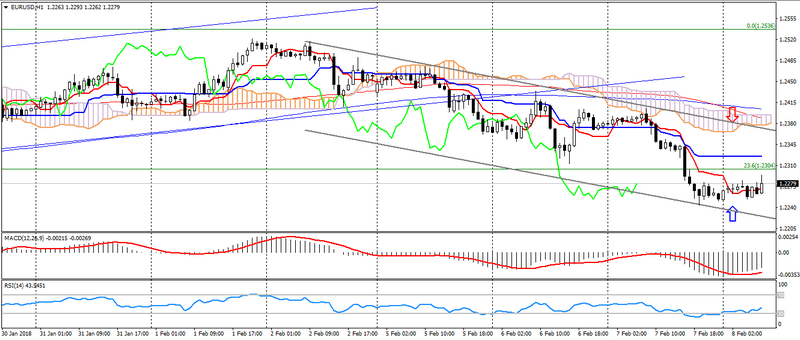
- Support levels: 1.2100 (September 2017 maximum), 1.1900, 1.1700.
- Resistance levels: 1.2600, 1.2750 (March 2013 minimum), 1.2270 (November 2014 minimum).
- Computer analysis: MACD (12,26,9) (signal-upward movement): the indicator is below 0, the signal line has left the histogram bar. RSI (14) is in the neutral zone. IchimokuKinkoHyo (9,26,52) (signal – downward movement): the Tenkan-sen line is below the Kijun-sen line, the price is below the cloud.
- The main recommendation: sale entry is started from 1.2320, 1.2350, 1.2380.
- Alternative recommendation: buy entry is started from 1.2250, 1.2220, 1.2190.
The euro after the next wave of decline, is traded with a slight correction. At the same time, in conditions of the general correction of the American, one should expect a test of the upper boundary of the ascending channel.
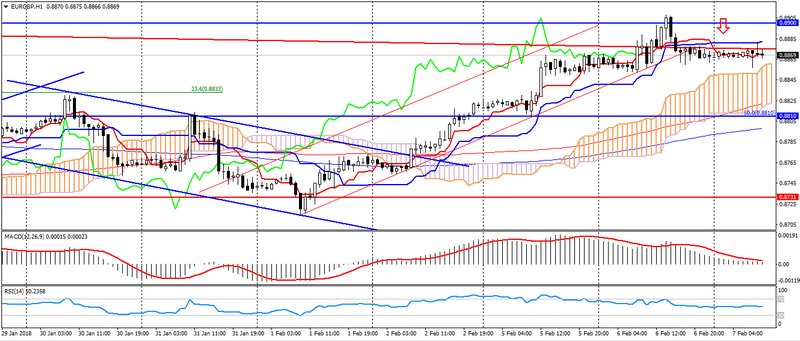
GBP USD (current price: 1.3900)
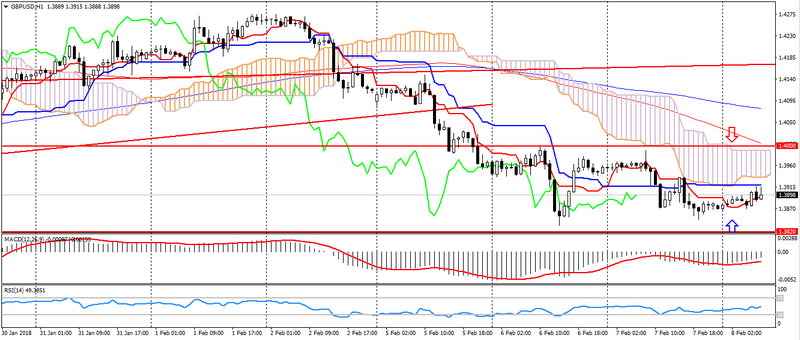
- Support levels: 1.4000 ( April 2016 minimum), 1.3820, 1.3650 (September 2017 maximum).
- Resistance levels: 1.43500, 1.4500, 1.4750 (May May 2016 maximum).
- Computer analysis: MACD (12,26,9) (signal – upward movement): the indicator is below 0, the signal line has left the histogram bar. RSI (14) is in the neutral zone. IchimokuKinkoHyo (9,26,52) (signal – downward movement): line Tenkan-senne is below line Kijun-sen, the price is below the cloud.
- The main recommendation: sale entry is started from 1.3940, 1.4000, 1.4030.
- Alternative recommendation: buy entry is started from 1.3870, 1.3820, 1.3800.
The British pound is traded in a sideways trend, limited to the support level of 1.3820.
USD CHF (current price: 0.9430)
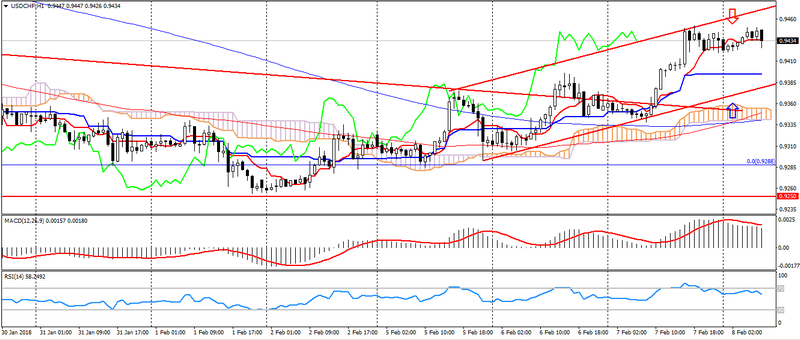
- Support levels: 0.9250 (August 2015 minimum), 0.9150, 0.9050 (May 2015 minimum).
- Resistance levels:, 0.9550, 0.9800, 1.0030 (November 2017 maaximum).
- Computer analysis: MACD (12,26,9) (signal – downward movement): the indicator is above 0, the signal line has left the histogram bar. RSI (14) is in the neutral zone. IchimokuKinkoHyo (9,26,52) (signal – upward movement): the Tenkan-sen line is above the Kijun-sen line, the price is higher than the cloud.
- The main recommendation: sale entry is started from 0.9460, 0.9480, 0.9510.
- Alternative recommendation: buy entry is started from 0.9390, 0.9370, 0.9340.
The Swiss franc remains in a downtrend, limited to overbought.
USD JPY (current price: 109.60)
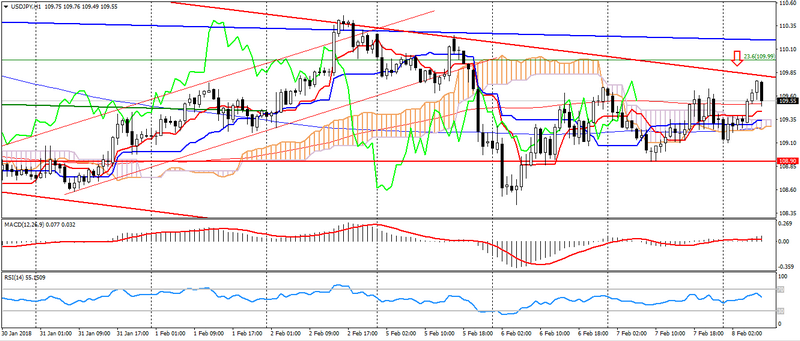
- Support levels: 108.90, 108.10 (April 2017 minimum), 107.30 ( 2017 minimum).
- Resistance levels: 110.80, 111.70 (October 2017 minimum), 113.70.
- Computer analysis: MACD (12, 26, 9) (signal – upward movement): the indicator is above 0, the signal line is in the body of the histogram. RSI (14) is in the neutral zone. IchimokuKinkoHyo (9,26,52) (signal- upward movement): the Tenkan-sen line is above the Kijun-sen line, the price is higher than the cloud.
- The main recommendation: sale entry is started from 109.80, 110.10, 110.40.
- Alternative recommendation: buy entry is started from 109.30, 108.90, 108.60.
The Japanese yen remains under pressure from the beginning of the day on the resumption of demand for risky assets, but the pair remains in a downward trend.
USD CAD (current price: 1.2560)
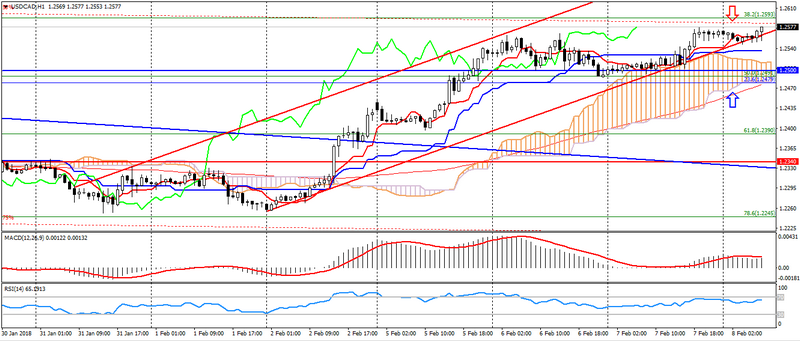
- Support levels: 1.2340.1.2200, 1.2060 (2017 minimum).
- Resistance levels: 1.2500, 1.2650, 1.2770 (August 2017 maximum).
- Computer analysis: MACD (12, 26, 9) (signal – downward movement): the indicator is above 0, the signal line has left the body of the histogram. RSI (14) is in the neutral zone. IchimokuKinkoHyo (9,26,52) (signal – upward movement): the Tenkan-sen line is above the Kijun-sen line, the price is higher than the cloud.
- The main recommendation: sale entry is started from 1.2570, 1.2590, 1.2620.
- Alternative recommendation: buy entry is started from 1.2530, 1.2500, 1.2480.
The Canadian dollar maintains a downward trend, while the further growth of this pair may be limited to the bearish divergence.
AUD USD (current price: 0.7830)
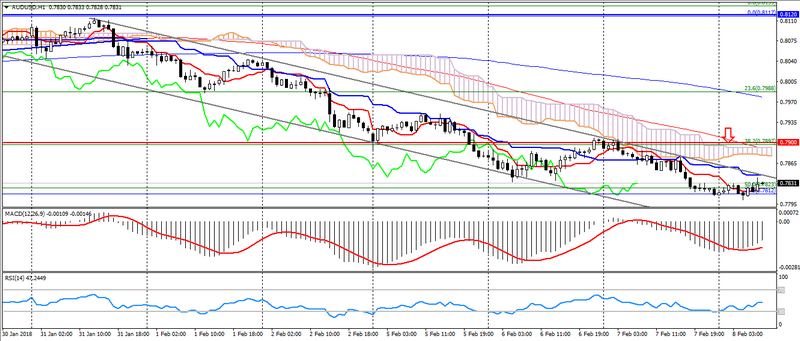
- Support levels: 0.7900, 0.7700 (March 2017 maximum), 0.7500.
- Resistance levels: 0.8120 (2017 maximum), 0.8200, 0.8290 (2014 maximum).
- Computer analysis: MACD (12, 26, 9) (signal – upward movement): the indicator is below 0, the signal line has left the body of the histogram. RSI (14) is in the neutral zone. IchimokuKinkoHyo (9,26,52) (signal – downward movement): the Tenkan-sen line is below the Kijun-sen line, the price is below the cloud.
- The main recommendation: sale entry is started from 0.7850, 0.7870, 0.7900.
- Alternative recommendation: buy entry is started from 0.7810, 0.7790, 0.7750.
The Australian maintains a downward trend, remaining in the oversold zone.
NZD USD (current price: 0.7210)
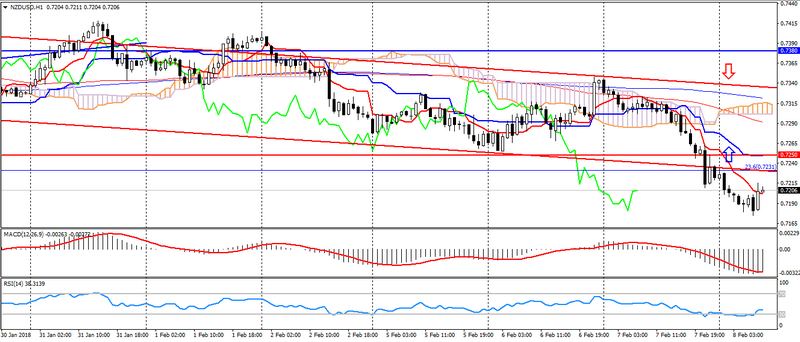
- Support levels: 0.7250, 0.7130 (August 2017 minimum), 0.7000.
- Resistance levels: 0.7380, 0.7450, 0.7550 (2017 maximum).
- Computer analysis: MACD (12, 26, 9) (signal-upward movement): the indicator is below 0, the signal line has left the body of the histogram. RSI (14) is in the neutral zone. IchimokuKinkoHyo (9,26,52) (signal – downward movement): the Tenkan-sen line is below the Kijun-sen line, the price is below the cloud.
- The main recommendation: sale entry is started from 0.7240, 0.7270, 0.7310.
- Alternative recommendation: buy entry is started from 0.7170, 0.7150, 0.7130.
The New Zealand dollar is in the oversold zone, which is caused by the publication of the RBNZ protocol.
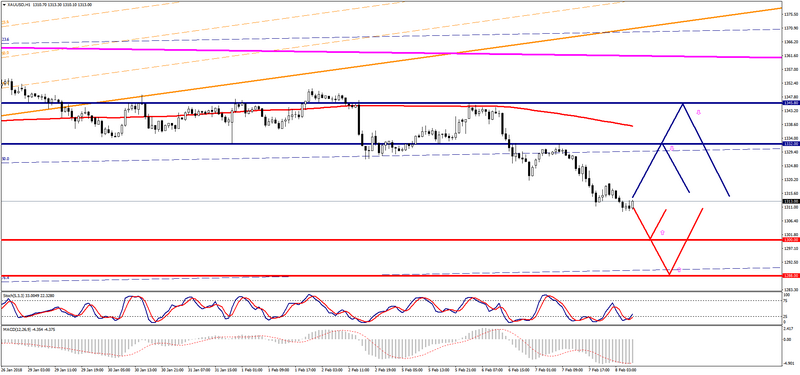
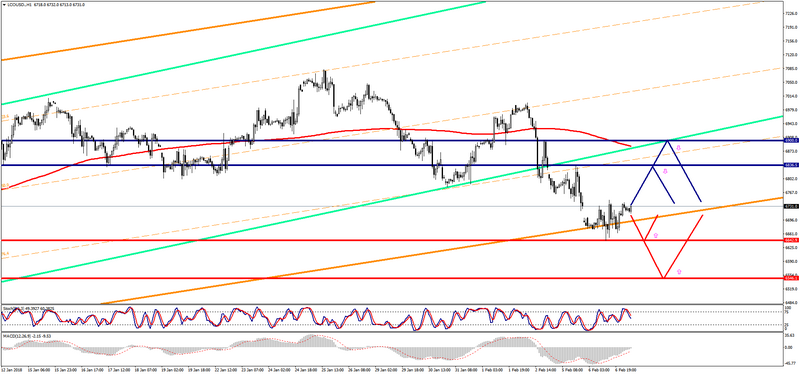
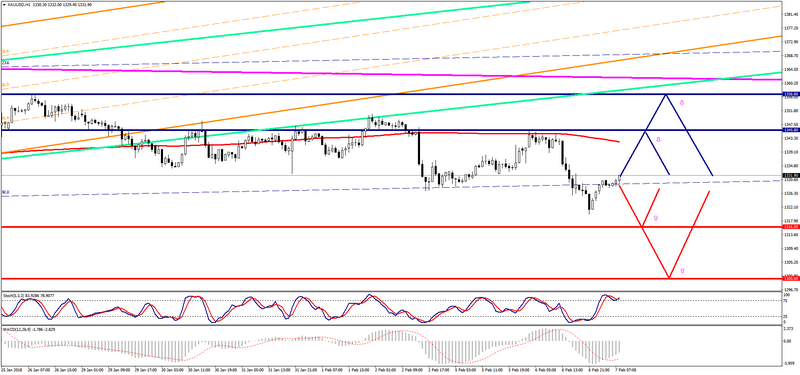
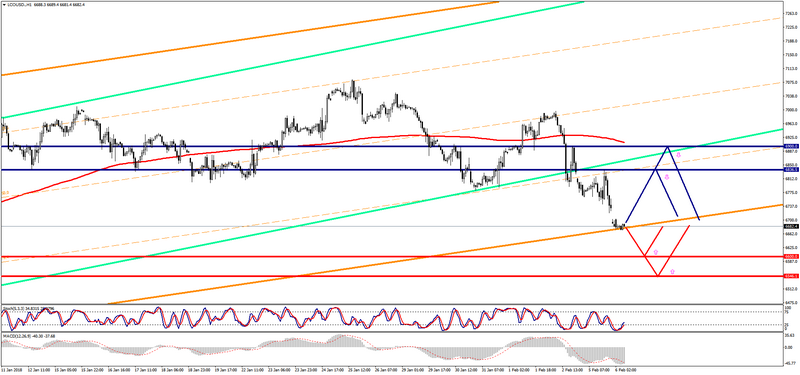
XAU USD (current price: 1311.00)
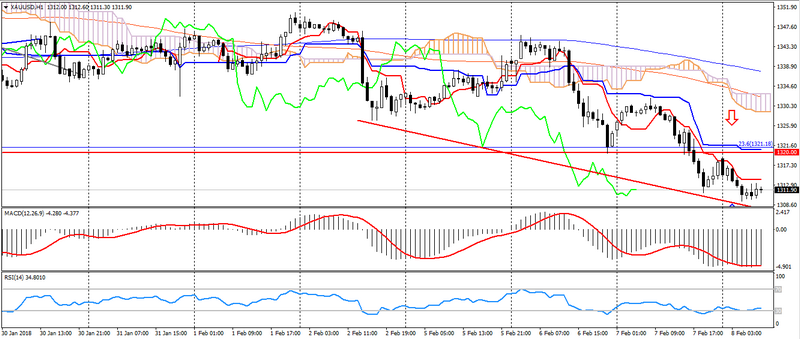
- Support levels: 1320.00, 1303.00, 1280.00.
- Resistance levels: 1355.00 (May May 2016 maximum), 1374.00, 1290.00 (March 2016 maximum).
- Computer analysis: MACD (12, 26, 9) (signal – downward movement): the indicator is below 0, the signal line is in the body of the histogram. RSI (14) is in the oversold zone. IchimokuKinkoHyo (9,26,52) (signal- upward movement): the Tenkan-sen line is below the Kijun-sen line, the price is below the cloud.
- The main recommendation: sale entry is started from 1317.00, 1320.00, 1328.00.
- Alternative recommendation: buy entry is started from 1309.00, 1304.00, 1300.00.
Gold maintains a downward trend, despite a significant oversold, which may serve as an excuse for correction.