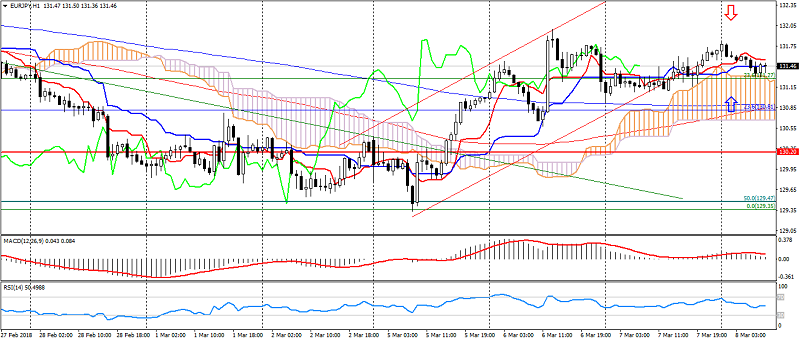
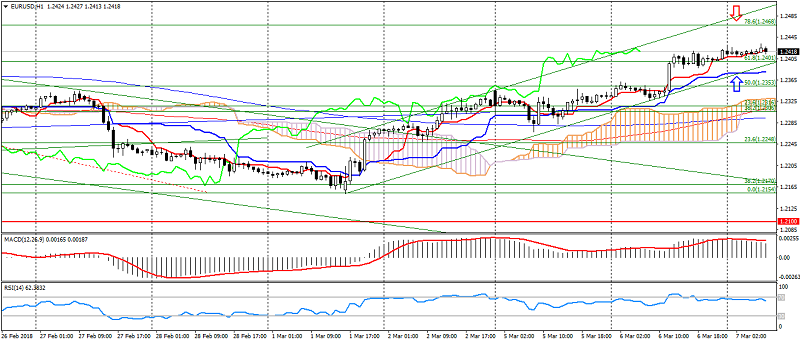
EUR USD (current price: 1.2400)
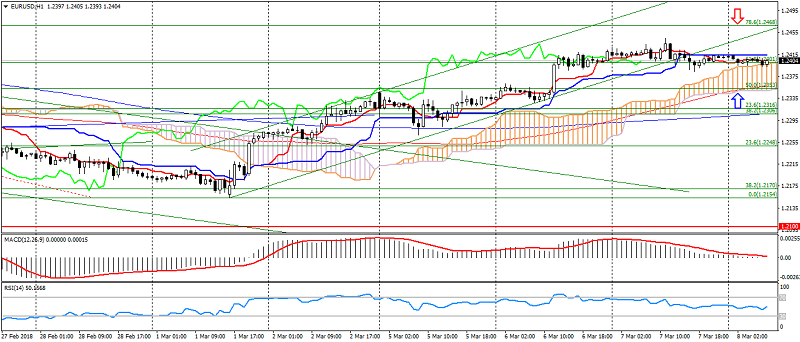
- Support levels: 1.2100 (September 2017 maximum), 1.1900, 1.1700.
- Resistance levels: 1.2600, 1.2750 (March 2013 minimum), 1.2270 (November 2014 minimum).
- Computer analysis: MACD (12,26,9) (signal- downward movement): the indicator is higher than 0, the signal line has left the histogram bar. RSI (14) is in the neutral zone. IchimokuKinkoHyo (9,26,52) (signal – downward movement, flat): the Tenkan-sen line is below the line Kijun-sen, the price is in the cloud.
- The main recommendation: sale entry is started from 1.2440, 1.2470, 1.2500.
- Alternative recommendation: buy entry is started from 1.2370, 1.2350, 1.2330.
The euro dollar has moved to the flat on expectations of the results of the ECB meeting, which also can be explained by correction after growth.
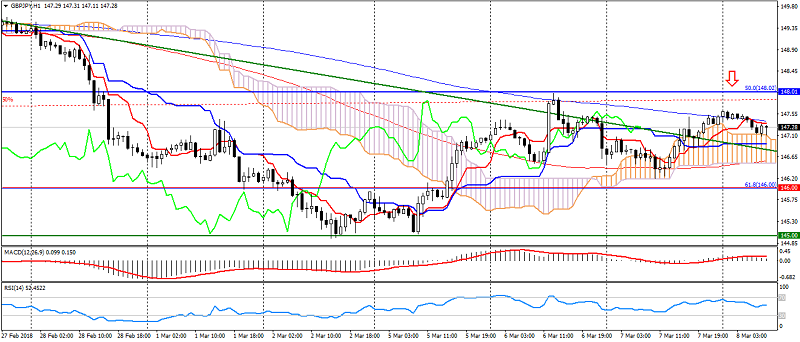
GBP USD (current price: 1.3890)
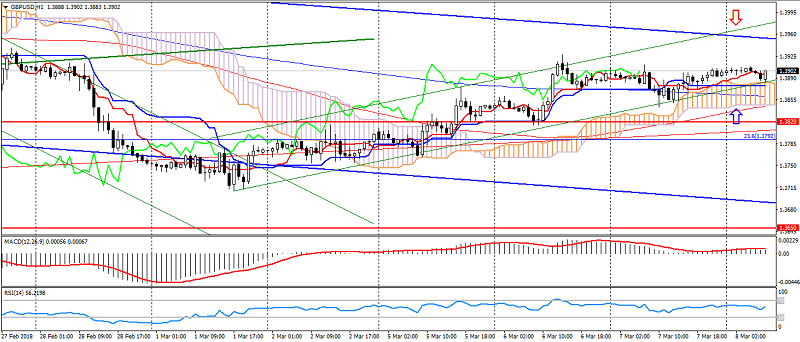
- Support levels: 1.3820,1.3650 (September 2017 maximum), 1.3450.
- Resistance levels: 1.4050, 1.4350, 1.4500.
- Computer analysis: MACD (12,26,9) (signal – downward movement): the indicator is above 0, the signal line has left the histogram bar. RSI (14) is in the neutral zone. IchimokuKinkoHyo (9,26,52) (signal – upward movement): the Tenkan-sen line is above the Kijun-sen line, the price is higher than the cloud.
- The main recommendation: sale entry is started from 1.3930, 1.3950, 1.3980.
- Alternative recommendation: buy entry is started from 1.3880, 1.3850, 1.3820.
The British pound also maintains an upward trend in the weakness of the American, but is limited to a downward trend that has been traced since early February and growing uncertainty.
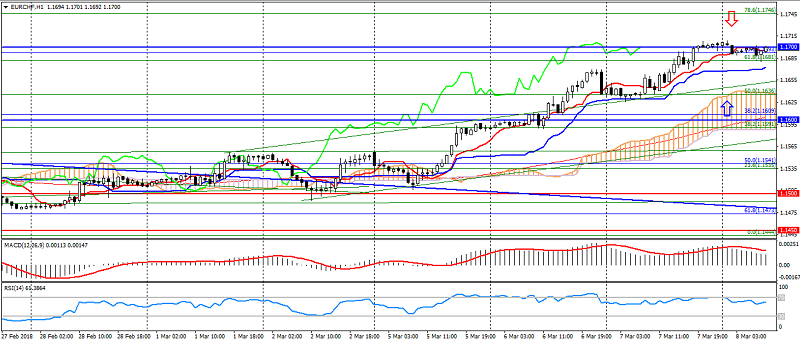
USD CHF (current price: 0.9420)
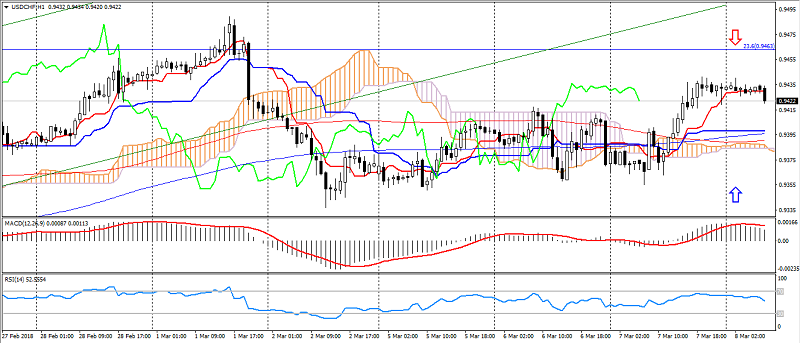
- Support levels: 0.9250 (August 2015 minimum), 0.9150, 0.9050 (May 2015 minimum).
- Resistance levels:, 0.9550, 0.9800, 1.0030 (November 2017 maximum).
- Computer analysis: MACD (12,26,9) (signal – downward movement): the indicator is higher than 0, the signal line has left the body of the histogram. RSI (14) is in the neutral zone. IchimokuKinkoHyo (9,26,52) (signal – upward movement): the Tenkan-sen line is above the Kijun-sen line, the price is higher than the cloud.
- The main recommendation: sale entry is started from 0.9450, 0.9480, 0.9500.
- Alternative recommendation: buy entry is started from 0.9400, 0.9370, 0.9350.
The Swiss franc is traded with a slight strengthening on the correction after yesterday’s decline, which was caused by a decrease in the risks of the US trade war.
USD JPY (current price: 105.90)
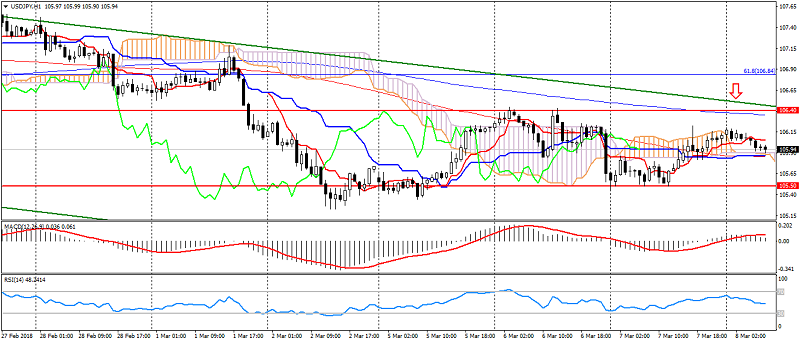
- Support levels: 106.40, 105.50, 104.50.
- Levels of resistance: 108.00, 108.60, 110.00.
- Computer analysis: MACD (12, 26, 9) (signal – downward movement): the indicator is above 0, the signal line has left the body of the histogram. RSI (14) is in the neutral zone. IchimokuKinkoHyo (9,26,52) (signal-upward movement): the Tenkan-sen line is above the Kijun-sen line, the price is higher than the cloud.
- The main recommendation: sale entry is started from 106.40, 106.80, 107.00.
- Alternative recommendation: buy entry is started from 105.50, 105.20, 105.00.
The Japanese yen retains the potential to strengthen on the resumption of flight from risks, despite a sideways trend.
USD CAD (current price: 1.2880)
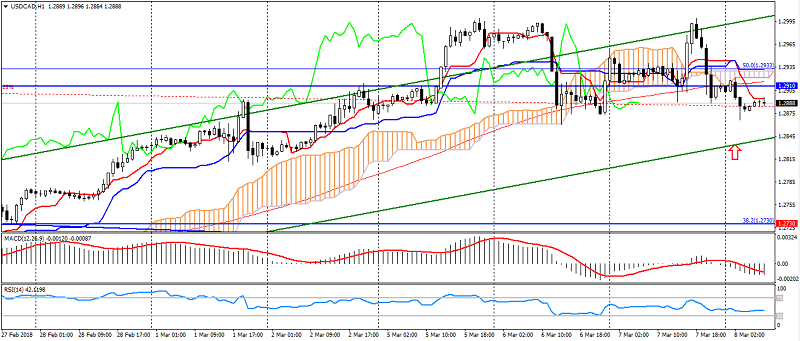
- Support levels: 1.2730,1.2600, 1.2500.
- Resistance levels: 1.2910 (November 2017 maximum), 1.3030, 1.3150.
- Computer analysis: MACD (12, 26, 9) (signal – downward movement): the indicator is below 0, the signal line is in the body of the histogram. RSI (14) is in the neutral zone. IchimokuKinkoHyo (9,26,52) (signal – downward movement): the Tenkan-sen line is below the Kijun-sen line, the price is below the cloud.
- The main recommendation: sale entry is started from 1.2910, 1.2960, 1.2990.
- Alternative recommendation: buy entry is started from 1.2950, 1.2830, 1.2800.
The Canadian dollar strengthened on lowering risks relative to the trade war, but is still clamped in a downward trend.
AUD USD (current price: 0.7820)
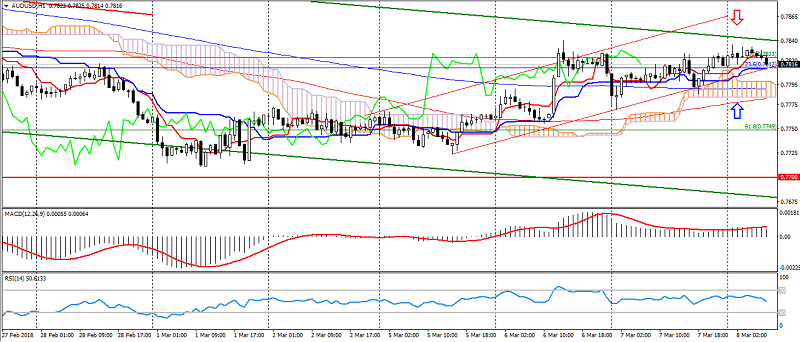
- Support levels: 0.7900, 0.7700 (March 2017 maximum), 0.7500.
- Resistance levels: 0.8120 (2017 maximum), 0.8200, 0.8290 (2014 maximum).
- Computer analysis: MACD (12, 26, 9) (signal – downward movement): the indicator is above 0, the signal line has left the body of the histogram. RSI (14) is in the neutral zone. IchimokuKinkoHyo (9,26,52) (signal – upward movement): the Tenkan-sen line is above the Kijun-sen line, the price is higher than the cloud.
- The main recommendation: sale entry is started from 0.7840, 0.7860, 0.7880.
- Alternative recommendation: buy entry is started from 0.7800, 0.7780, 0.7750.
The Australian maintains an upward trend in resuming optimism on the market and American weakness, while limiting itself to a general downtrend.
NZD USD (current price: 0.7280)
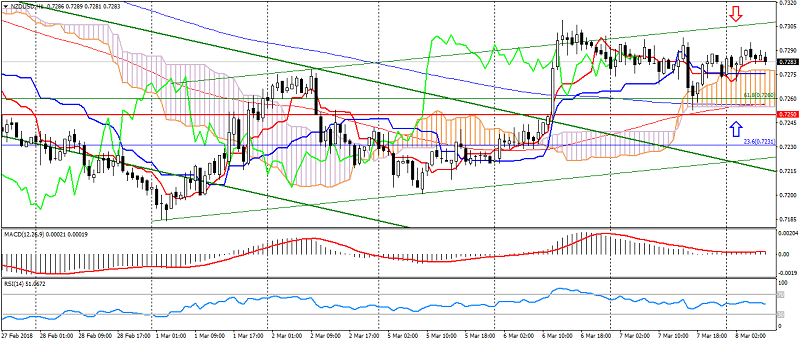
- Support levels: 0.7250, 0.7130 (August 2017 minimum), 0.7000.
- Resistance levels: 0.7380, 0.7450, 0.7550 (2017 maximum).
- Computer analysis: MACD (12, 26, 9) (signal-upward movement): the indicator is above 0, the signal line is in the body of the histogram. RSI (14) is in the neutral zone. IchimokuKinkoHyo (9,26,52) (signal – upward movement): the Tenkan-sen line is above the Kijun-sen line, the price is higher than the cloud.
- The main recommendation: sale entry is started from 0.7300, 0.7320, 0.7350.
- Alternative recommendation: buy entry is started from 0.7260, 0.7230, 0.7200.
The New Zealand dollar keeps rising dynamics on the weakness of the American.
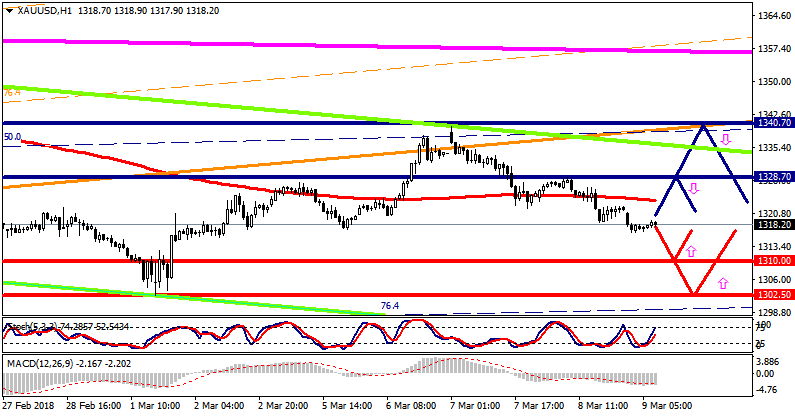
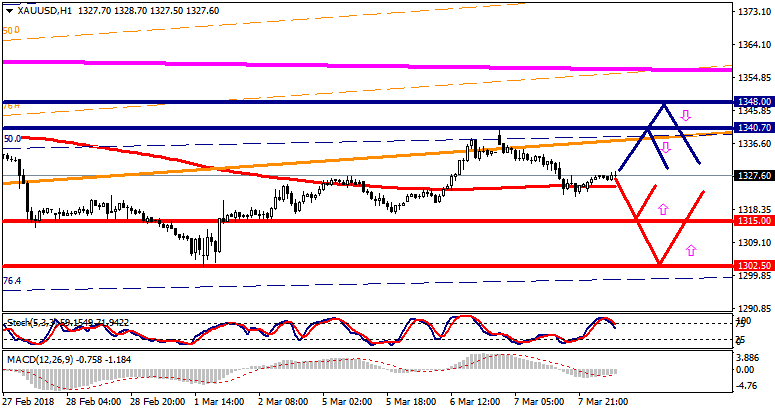
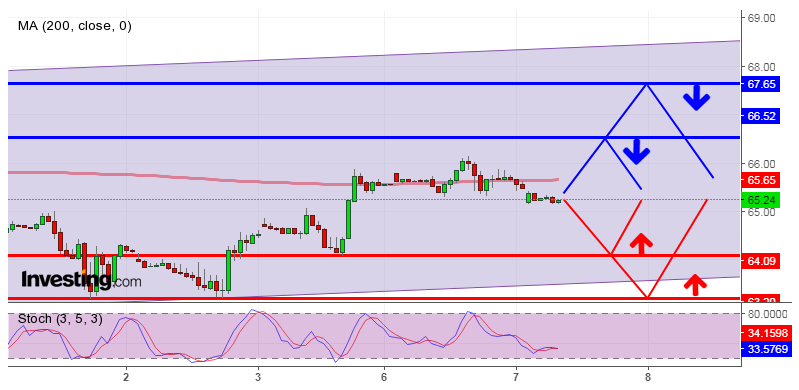
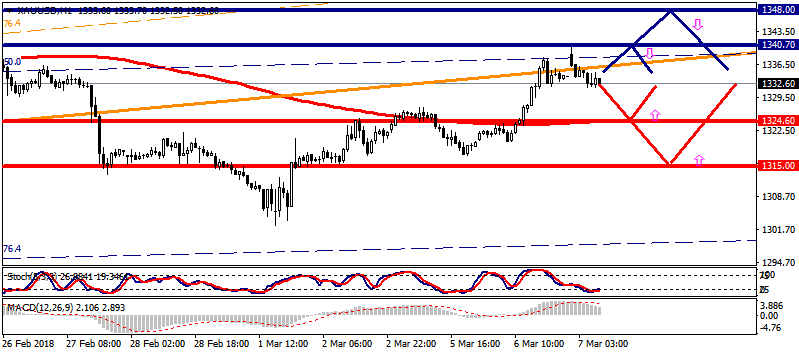
XAU USD (current price: 1328.00)
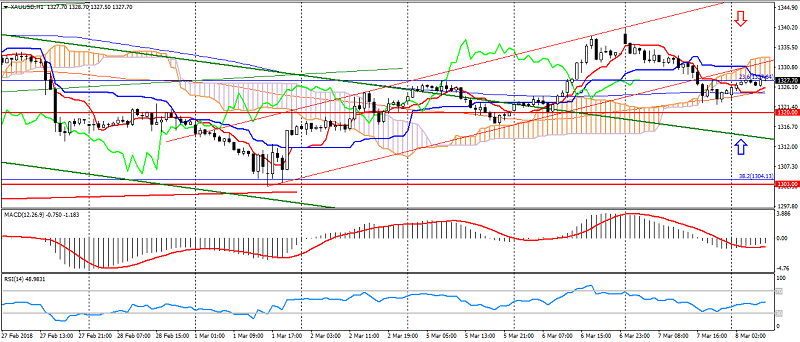
- Support levels: 1320.00, 1303.00, 1280.00.
- Resistance levels: 1355.00 (May May 2016 maximum), 1374.00, 1290.00 (March 2016 maximum).
- Computer analysis: MACD (12, 26, 9) (signal – downward movement): the indicator is below 0, the signal line has left the body of the histogram. RSI (14) is in the neutral zone. IchimokuKinkoHyo (9,26,52) (signal- downward mvoement): the Tenkan-sen line is below the Kijun-sen line, the price is below the cloud.
- The main recommendation: sale entry is started from 1335.00, 1340.00, 1344.00.
- Alternative recommendation: buy entry is started from 1320.00, 1316.00, 1312.00.
Gold, after trying to grow, moved to flat, thereby breaking the downward dynamics.