
Технический анализ нефти (Александр Сивцов)
Нефть торгуется выше нулевых отметок в ходе Азиатской сессии.
График марки Brent (текущая цена: $65.67)
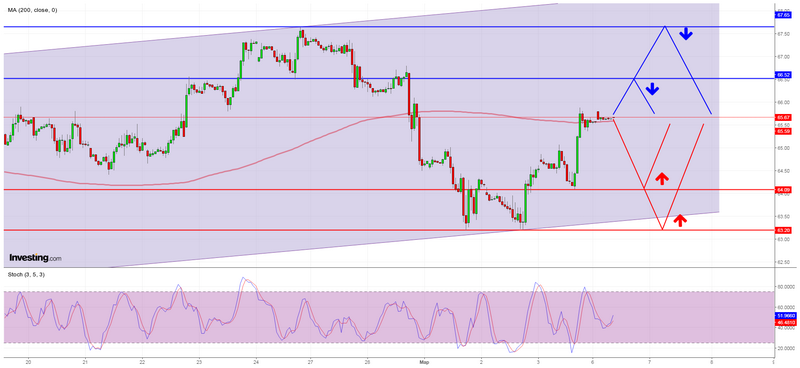
Марка Brent торгуется выше нулевой отметки в ходе Азиатской сессии.
- Сопротивление 1: С$66.52 (минимум 26 февраля)
- Сопротивление 2: С$67.65 (максимум 26 февраля)
- Поддержка 1: С$64.09 (минимум 5 марта)
- Поддержка 2: С$63.20 (минимум 1 марта)
Компьютерный анализ: Мувинги индикатора форекс Stochastic Oscillator на графике Н1 находятся в нейтральной зоне, на фоне чего возможно продолжение консолидации цены марки Brent.
График марки WTI (текущая цена: $62.73)
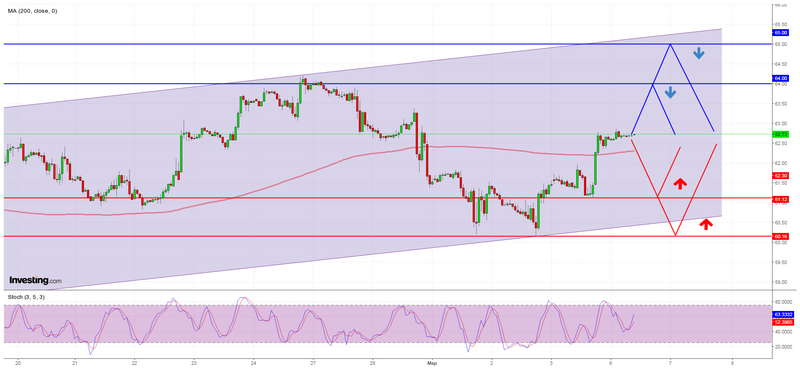
Марка WTI ведет с небольшим плюсом в ходе Азиатской сессии.
- Сопротивление 1: С$64.00 (психологический уровень)
- Сопротивление 2: С$65.00 (психологический уровень)
- Поддержка 1: С$61.12 (минимум 5 марта)
- Поддержка 2: С$60.16 (минимум 2 марта)
Компьютерный анализ: Мувинги индикатора форекс Stochastic Oscillator на графике Н1 находятся в нейтральной зоне, в связи с чем стоит ожидать продолжения движения цены WTI в узком диапазоне.