
Technical Analysis of Oil (Alexander Sivtsov)
Oil is traded above the zero mark in the Asian session.
Brent graph (current price: $ 65.67)
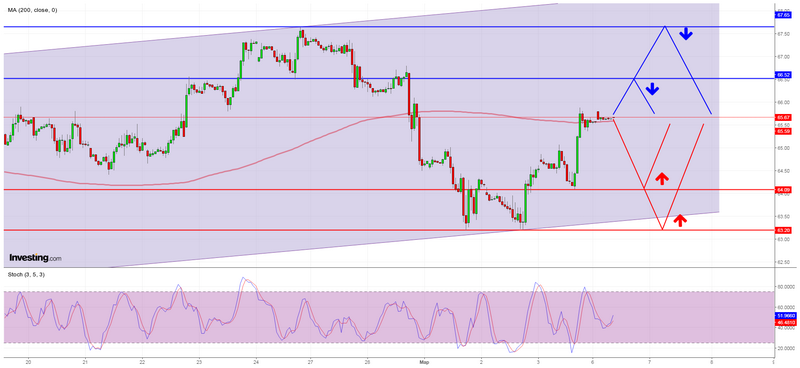
The Brent brand is traded above the zero mark during the Asian session.
- Resistance 1: From $ 66.52 (February 26 minimum)
- Resistance 2: From $ 67.65 (February 26 maximum)
- Support 1: From $ 64.09 (March 5 minimum)
- Support 2: From $ 63.20 (March 1 minimum)
Computer analysis: The Stochastic Oscillator movings on the chart H1 are in the neutral zone. The continuation of the consolidation of the Brent price is possible.
WTI graph (current price: $ 62.73)
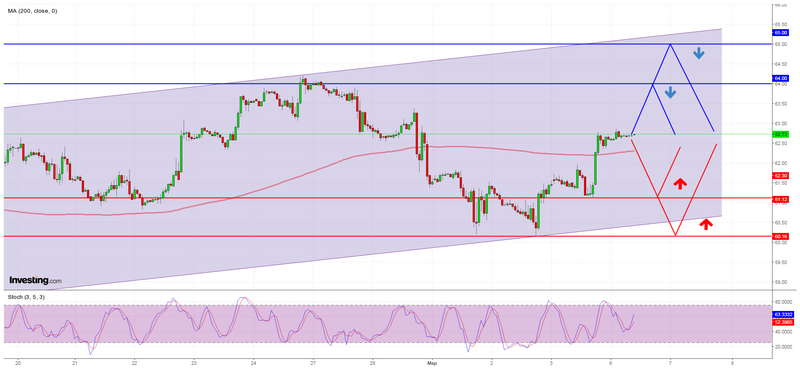
The WTI brand has a slight advantage during the Asian session.
- Resistance 1: From $ 64.00 (psychological level)
- Resistance 2: From $ 65.00 (psychological level)
- Support 1: From $ 61.12 (March 5 minimum)
- Support 2: From $ 60.16 (March 2 minimum)
Computer analysis: The Stochastic Oscillator movings on the chart H1 are in the neutral zone, so one should expect the continuation of the WTI price movement in a narrow range.