技术分析

Technical analysis of gold and silver (Andre Green)

Forex indicators used in Technical analysis: MACD, RSI, Ichimoku Kinko Hyo, Equal-channel, Fibonacci lines, Price Levels.

Earn with the help of the trade service on the news Erste News!


Gold chart (current price: $ 1294.00)


Gold remains under the pressure of correction, but retains the potential for growth on risks.
Technical analysis of oil (Dani Leviant)

Forex indicators used in Technical analysis: MACD, RSI, Ichimoku Kinko Hyo, Equal-channel, Fibonacci lines, Price Levels.

Earn with the help of the trade service on the news Erste News!


Oil quotes were under the pressure of correction and reduce optimism.

Brent brand chart (current price: $ 60.70)


Brent brand trades with a decrease in the correction and rebound from the upper boundary of the trading channel.

Technical analysis of cross-rates. (Anton Hanzenko)

Forex indicators used in Technical analysis: MACD, RSI, Ichimoku Kinko Hyo, Equal-channel, Fibonacci lines, Price Levels.

Earn with the help of the trade service on the news Erste News!


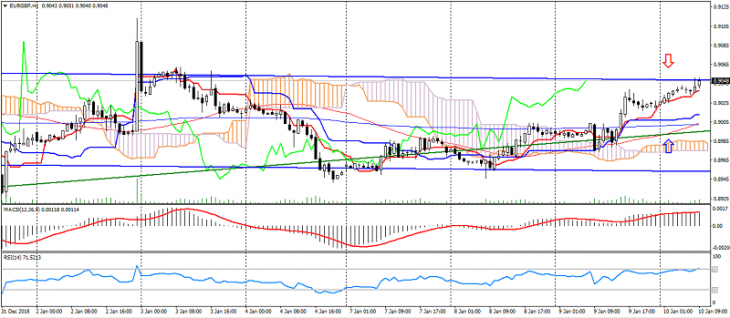
EUR GBP (current price: 0.9050)

  • Support levels: 0.8900, 0.8850, 0.8750.
  • Resistance levels: 0.9050, 0.9150, 0.9200.
  • Computer analysis: MACD (12, 26, 9) (signal – upward movement): the indicator is above 0, the signal line in the body of the histogram. RSI (14) in the overbought zone. Ichimoku Kinko Hyo (9, 26, 52) (signal – upward movement): Tenkan-sen line is above the Kijun-sen line, the price is above the cloud.

Тechnical analysis of currency pairs (Anton Hanzenko)

Forex indicators used in Technical analysis: MACD, RSI, Ichimoku Kinko Hyo, Equal-channel, Fibonacci lines, Price Levels.

Earn with the help of the trade service on the news Erste News!


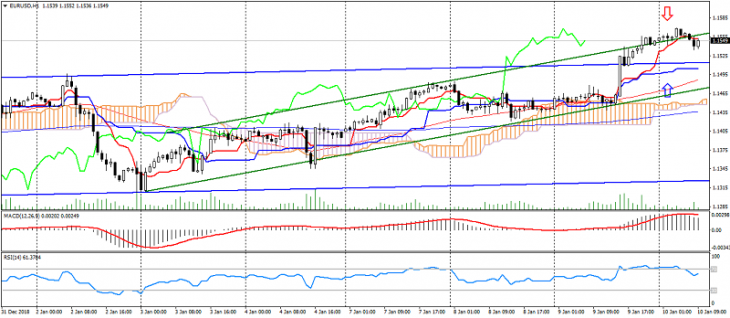
EUR USD (current price: 1.1550)

  • Support levels: 1.1350, 1.1200, 1.1100.
  • Resistance levels: 1.1450, 1.1550, 1.1650.
  • Computer analysis: MACD (12, 26, 9) (signal – downward movement): the indicator is above 0, the signal line came out of the histogram body. RSI (14) in the neutral zone. Ichimoku Kinko Hyo (9, 26, 52) (signal – upward movement): Tenkan-sen line is above the Kijun-sen line, the price is above the cloud.

Technical analysis of gold and silver (Andre Green)

Forex indicators used in Technical analysis: MACD, RSI, Ichimoku Kinko Hyo, Equal-channel, Fibonacci lines, Price Levels.

Earn with the help of the trade service on the news Erste News!


Gold chart (current price: $ 1282.00)


Gold remains under the pressure of correction, on the growth of optimism.

Technical analysis of oil (Dani Leviant)

Forex indicators used in Technical analysis: MACD, RSI, Ichimoku Kinko Hyo, Equal-channel, Fibonacci lines, Price Levels.

Earn with the help of the trade service on the news Erste News!


Oil quotes continue to grow on the overall optimism associated with the US-China trade negotiations.

Brent brand chart (current price: $ 59.40)


Brent brand is trading near monthly highs, indicating a full-scale correction.

Technical analysis of cross-rates. (Anton Hanzenko)

Forex indicators used in Technical analysis: MACD, RSI, Ichimoku Kinko Hyo, Equal-channel, Fibonacci lines, Price Levels.

Earn with the help of the trade service on the news Erste News!


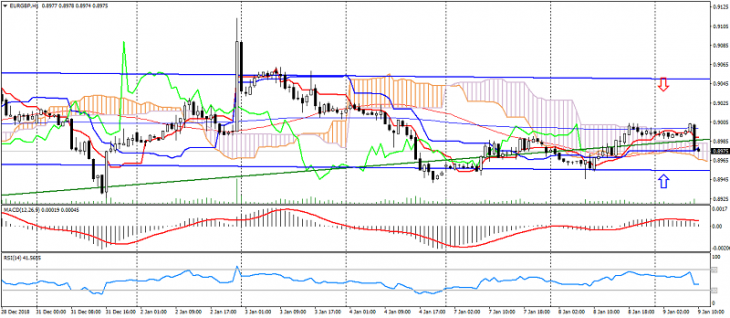
EUR GBP (current price: 0.8980)

  • Support levels: 0.8900, 0.8850, 0.8750.
  • Resistance levels: 0.9050, 0.9150, 0.9200.
  • Computer analysis: MACD (12, 26, 9) (signal – downward movement): the indicator is above 0, the signal line came out of the histogram body. RSI (14) in the neutral zone. Ichimoku Kinko Hyo (9, 26, 52) (signal – flat): Tenkan-sen line is above Kijun-sen line, the price is in the cloud.

Тechnical analysis of currency pairs (Anton Hanzenko)

Forex indicators used in Technical analysis: MACD, RSI, Ichimoku Kinko Hyo, Equal-channel, Fibonacci lines, Price Levels.

Earn with the help of the trade service on the news Erste News!


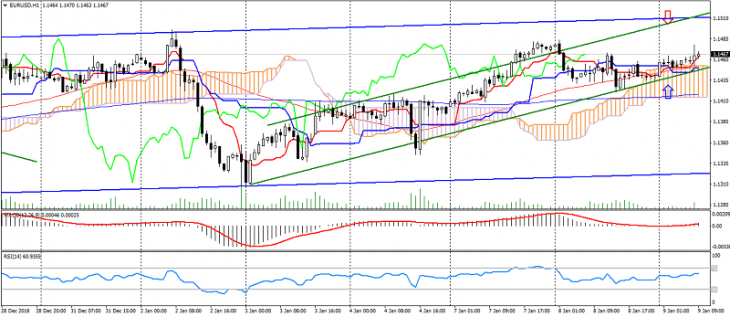
EUR USD (current price: 1.1460)

  • Support levels: 1.1350, 1.1200, 1.1100.
  • Resistance levels: 1.1450, 1.1550, 1.1650.
  • Computer analysis: MACD (12, 26, 9) (signal – upward movement): the indicator is above 0, the signal line in the body of the histogram. RSI (14) in the neutral zone. Ichimoku Kinko Hyo (9, 26, 52) (signal – upward movement): Tenkan-sen line is above the Kijun-sen line, the price is above the cloud.

Technical analysis of gold and silver (Andre Green)

Forex indicators used in Technical analysis: MACD, RSI, Ichimoku Kinko Hyo, Equal-channel, Fibonacci lines, Price Levels.

Earn with the help of the trade service on the news Erste News!


Gold chart (current price: $ 1282.00)


Gold remains under correction pressure, maintaining an upward trend.