
Technical analysis of gold and silver (Alexander Sivtsov)
Gold chart (current price: $ 1332.20)
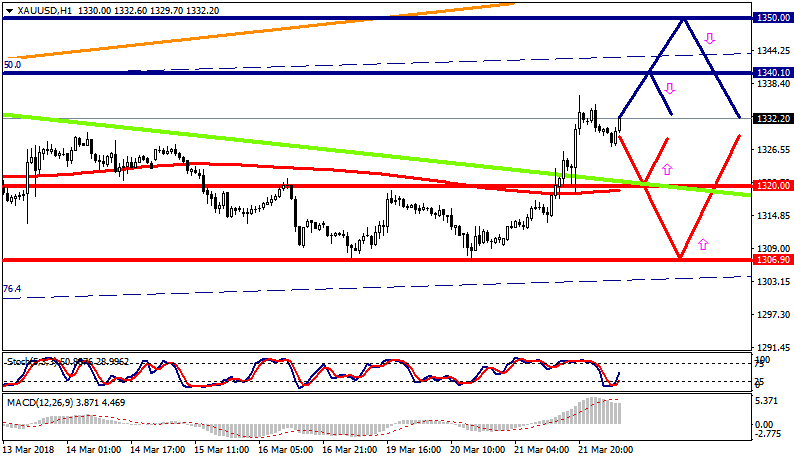
Gold is traded above the zero mark during the Asian session.
- Resistance 1: From $ 1340.10 (March 7 maximum)
- Resistance 2: From $ 1350.00 (technical level)
- Support 1: With $ 1320.00 (broken resistance line of Low channel on H1)
- Support 2: From $ 1306.90 (March 20 minimum)
Computer analysis: The Stochastic Oscillator movings on the H4 chart indicate overbought of the instrument, against which one should expect a decline in the price of gold.
Silver chart (current price: $ 16.52)

Silver is traded with a plus during the Asian session.
- Resistance 1: From $ 16.64 (technical level)
- Resistance 2: From $ 16.82 (March 6 maximum)
- Support 1: From $ 16.31 (technical level)
- Support 2: From $ 16.07 (March 20 minimum)
Computer analysis: The Stochastic Oscillator movings on the chart H4 indicate overbought of the instrument, the reduction of the price of silver is possible.