Technical analysis of gold and silver (Alexander Sivtsov)
Gold Chart (current price: $ 1317.90)

Gold is trading near the zero mark during the Asian session.
- Resistance 1: From $ 1340.70 (February 26 maximum)
- Resistance 2: From $ 1329.70 (March 14 maximum)
- Support 1: From $ 1302.50 (March 1 minimum)
- Support 2: From $ 1295.00 (technical level)
Computer analysis: The movings of the Stochastic Oscillator forex indicator on the chart H1 are in the overbought zone, against which it is expected to decrease the price of gold in the second half of the auction.
Silver Chart (current price: $ 16.40)
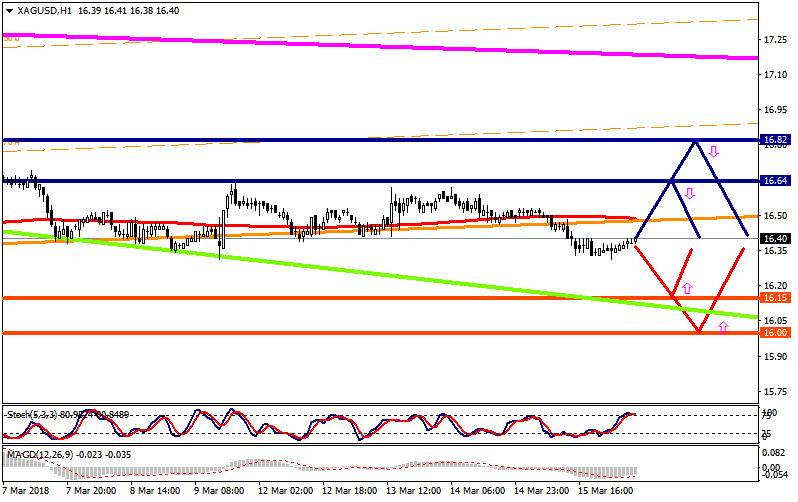
Silver is traded with a small plus during the Asian session.
- Resistance 1: From $ 16.64 (March 9 maximum)
- Resistance 2: From $ 16.82 (March 6 maximum)
- Support 1: From $ 16.15 (technical level)
- Support 2: From $ 16.00 (psychological level)
Computer analysis: The movings of the Stochastic Oscillator forex indicator on the chart H1 are in the overbought zone, against which a resumption of the price reduction of silver is possible.