
Technical analysis of gold and silver (Alexander Sivtsov)
Gold chart (current price: $ 1321.30)
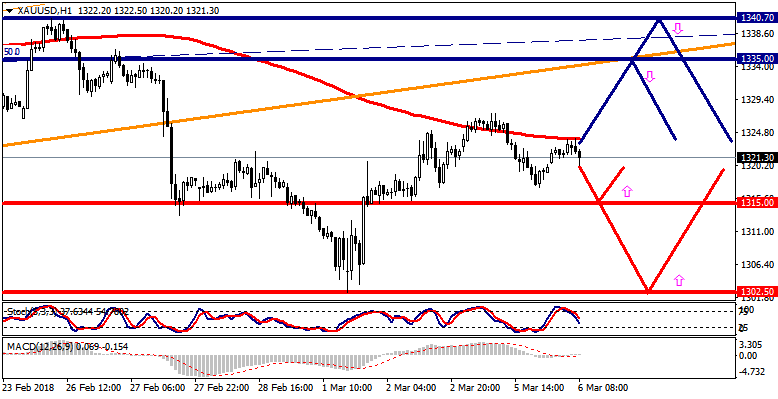
Gold is traded above the zero mark during the Asian session.
- Resistance 1: From $ 1335.00 (broken support line of the Up channel on H4)
- Resistance 2: From $ 1340.70 (February 26 maximum)
- Support 1: From $ 1315.00 (technical level)
- Support 2: From $ 1302.50 (March 1 minimum)
Computer analysis: The Stochastic Oscillator movings on the chart H4 are in the neutral zone, one can expect consolidation of the price of gold.
Silver chart (current price: $ 16.40)
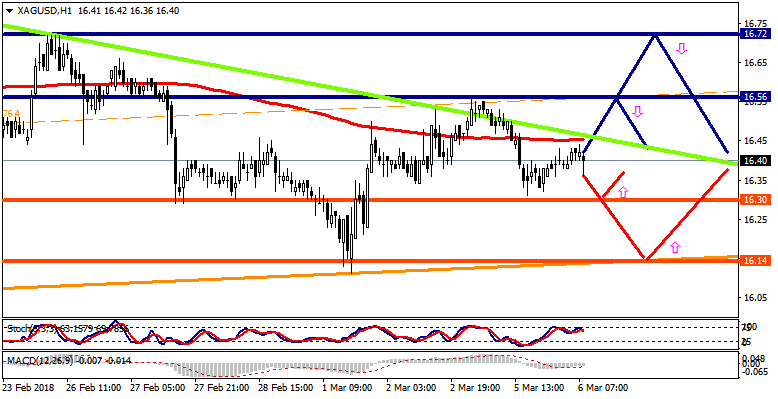
Silver is traded with a plus during the Asian session.
- Resistance 1: From $ 16.56 (March 5 maximum)
- Resistance 2: From $ 16.72 (February 26 maximum)
- Support 1: From $ 16.30 (technical level)
- Support 2: From $ 16.14 (February 9 minimum)
Computer analysis: The Stochastic Oscillator movings on the chart H4 are in the neutral zone, the movement of silver prices in a narrow range is possible.