
Technical analysis of gold and silver (Alexander Sivtsov)
Gold chart (current price: $ 1308.90)
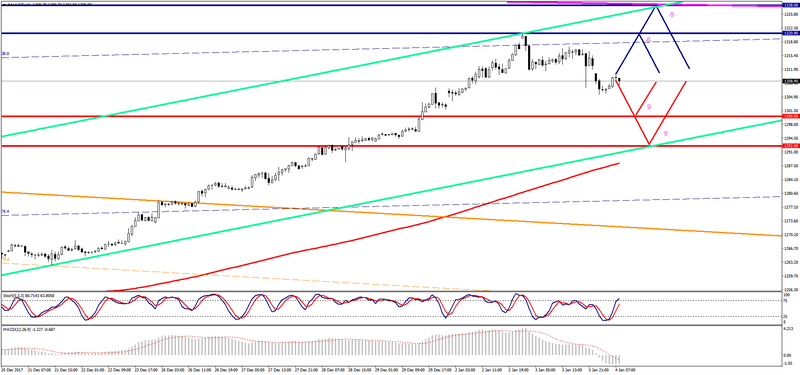
Gold is traded in the red zone during the Asian session.
- Resistance 1: From $ 1320.90 (December 3 maximum)
- Resistance 2: From $ 1328.00 (resistance line of Low channel on W1)
- Support 1: From $ 1300.00 (psychological level)
- Support 2: With $ 1292.50 (Support line of Up Channel on H1)
Computer analysis: The Stochastic Oscillator movings on the charts of H 1 and H 4 are in the neutral zone, one should expect consolidation of the price of gold.
Silver chart (current price: $ 16.99)
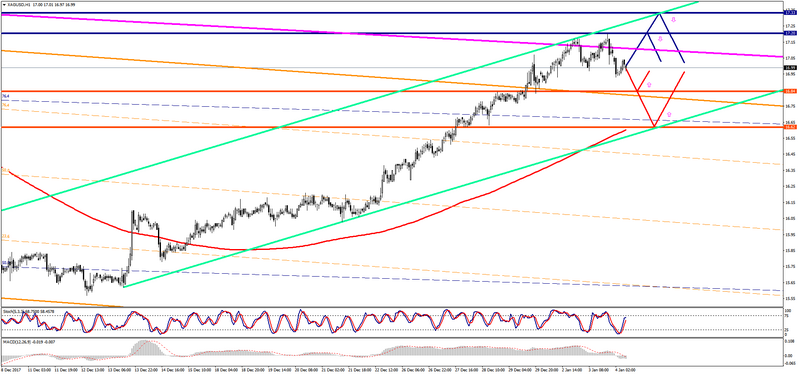
Silver is traded below the zero mark during the Asian session.
- Resistance 1: From $ 17.20 (December 3 maximum)
- Resistance 2: From $ 17.33 (November 17 maximum)
- Support 1: From $ 16.84 (December 28 maximum)
- Support 2: From $ 16.62 (December 28 minimum)
Computer analysis: The Stochastic Oscillator movings on the charts of H 1 and H 4 are in the neutral zone, the consolidation of the silver price is possible.