
Technical analysis of gold and silver (Alexander Sivtsov)
Gold chart (current price: $ 1313.00)
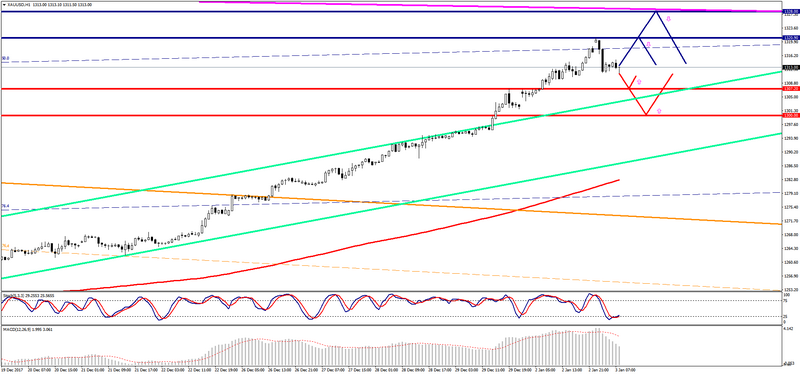
Goldis is traded near the zero mark during the Asian session.
- Resistance 1: C $ 1320.90 (December 3 maximum )
- Resistance 2: From $ 1328.00 (Resistance Line of Low Channel on W1)
- Support 1: From $ 1307.20 (December 29 maximum)
- Support 2: From $ 1300.00 (psychological level)
Computer analysis: The Stochastic Oscillator movings on the H1 graph point to the oversold of the instrument, so the increase of the gold price is possible.
Silver chart (current price: $ 17.02)
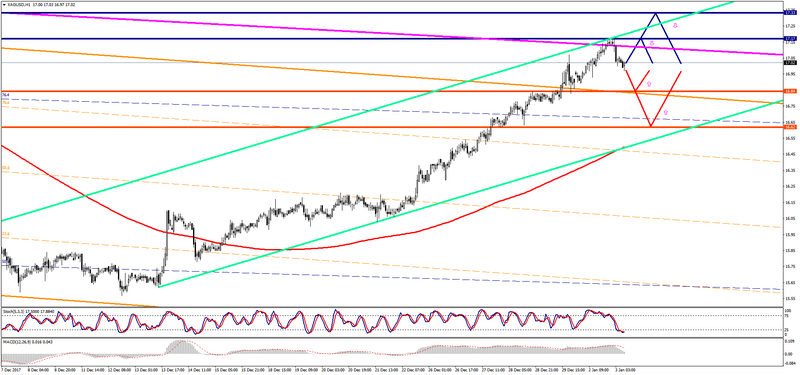
Silver is traded below the zero mark during the Asian session.
- Resistance 1: From $ 17.17 (December 3 maximum )
- Resistance 2: From $ 17.33 (November 17 maximum)
- Support 1: From $ 16.84 (December 28 maximum )
- Support 2: C $ 16.62 (December 28 minimum)
Computer analysis: The Stochastic Oscillator movings on the H1 graph point to the oversold of the instrument, which may result in the resumption in the increase of a silver price.